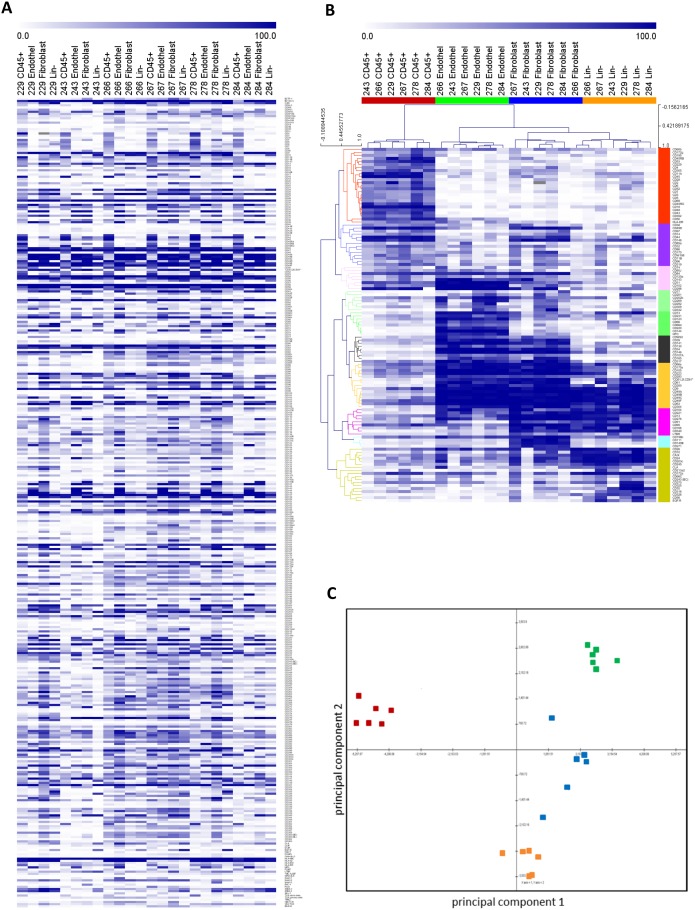
Figure 4. HT-FC allows intratumoral analysis of stromal and cancer cell subsets within primary ccRCC samples.
(A) Heatmap showing expression of each of the 363 antibodies in four subpopulations of ccRCC samples: CD45+ immune cells, CD45−CD31+CD34+ vascular endothelial cells, CD45−TE7+ fibroblasts, and CD45−TE7−CD31−CD34− cancer cells. Antibodies are simply arranged in alphabetical order on the vertical axis and the four populations for each sample are ordered across the top. A low resolution overview demonstrates a surprisingly reproducible “fingerprint” of tumor cell subpopulations from one sample to the next. (B) Supervised hierarchical clustering reveals clusters of antigens corresponding to specific cell subsets within tumors (see Table S6 for details). (C) Principal components analysis of the entire data set further illustrates how effectively the cell surface profile delineates the 4 distinct cell populations within primary ccRCC samples. Red: immune cells; Green: endothelial cells; Blue: fibroblasts; Orange: cancer cells.

