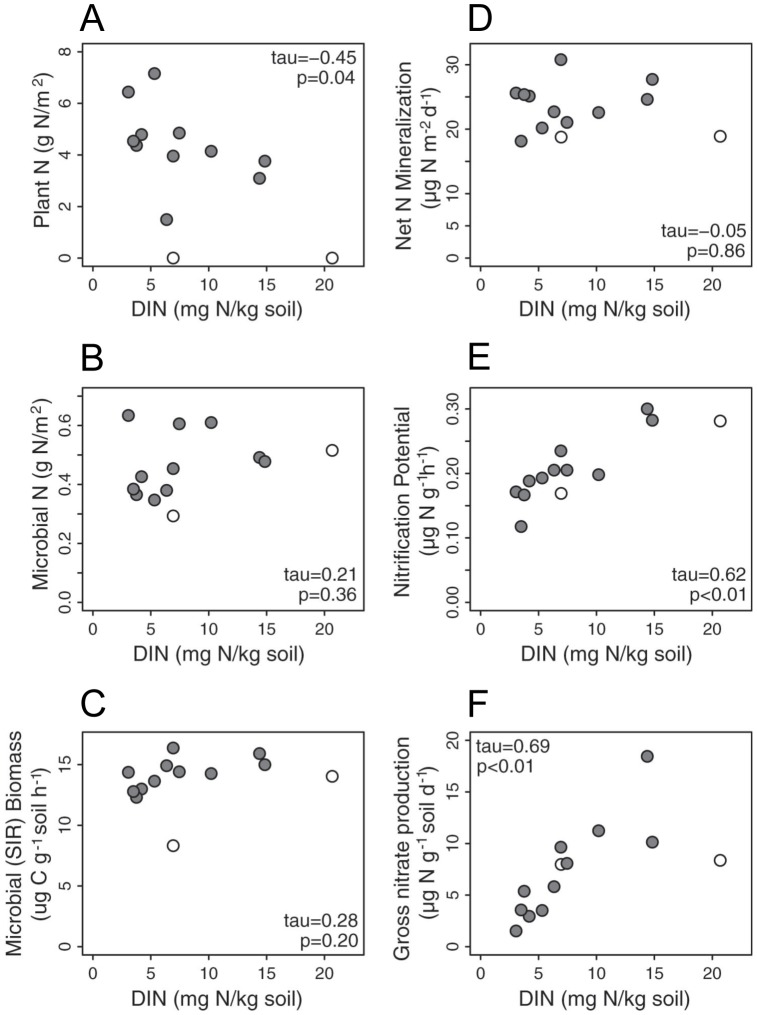
Figure 3. Comparison of soil DIN and plant and microbial metrics.
A total plant N, B Microbial N, C Microbial biomass measured by substrate induced respiration (SIR), D Potential net N mineralization, E Nitrification potential, and F Gross nitrification for monocultures and bare plots. White dots represent bare and bare seeded plots, grey dots are vegetated plots.

