
Figure 5. Revised conceptual model plant and microbial contributions to driving DIN (our indicator of R*) in this annual system.
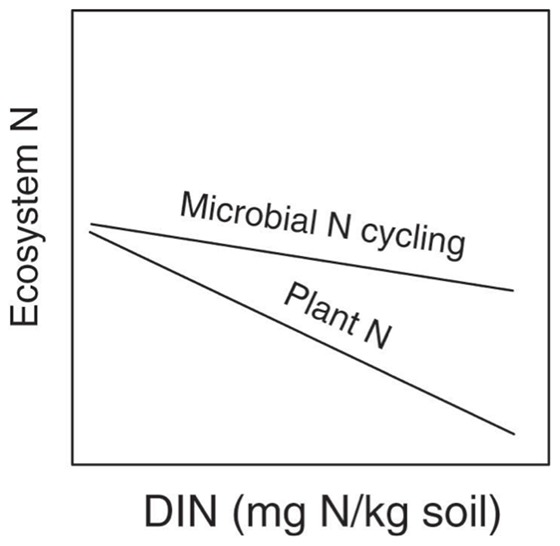
In contrast to models shown in Figure 1, in this model, DIN decreases as plant N increases due to plant uptake (Figure 3A), similar to earlier predictions (Figure 1A,B). In addition, greater plant biomass N may have been obtained through stimulation of microbial N cycling (Figure 4), in contrast to earlier predictions (Figure 1B,C).