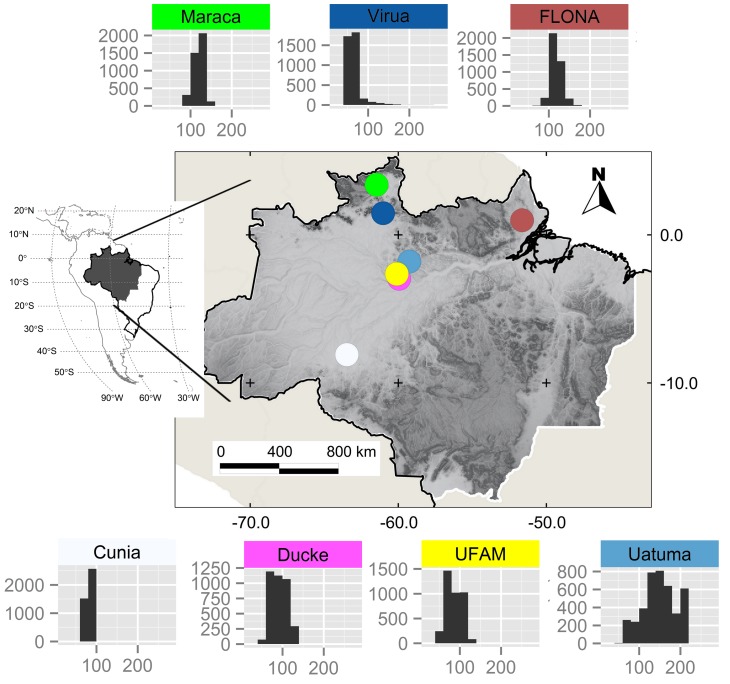
Figure 1. Distribution of seven active research sites within the Brazilian Amazon.
Site locations (circles) are overlaid on a 30 arc-second shaded relief map derived from mean altitude values [45] distributed by the U.S. Geological Survey (USGS) Earth Resources Observation & Science (EROS) Center (http://topotools.cr.usgs.gov/gmted_viewer/). Histograms show the frequency distribution of SRTM altitude values (90 m resolution) within the study sites, with counts (y-axis) grouped in 20 meter altitude bins (x-axis).

