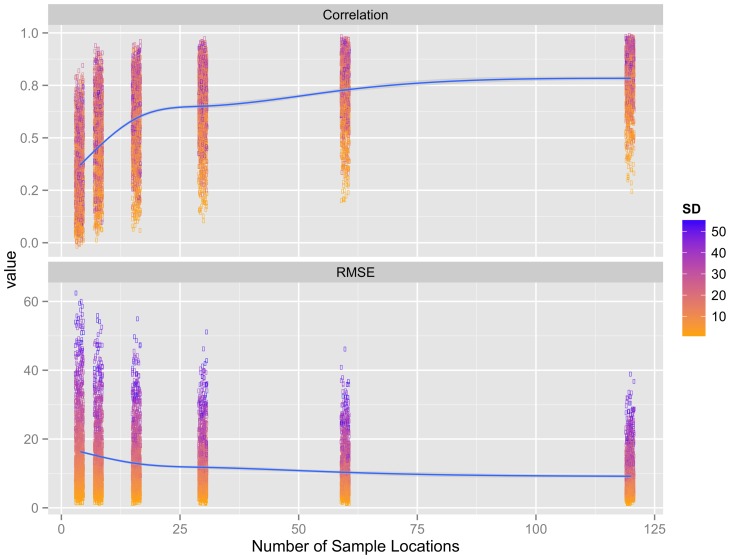
Figure 3. Trends in interpolation adequacy with increasing sample size.
IDW (Inverse Distance Weighted) models were used to interpolate altitude (SRTM DEM) based on values from regularly distributed sample locations (n: 4, 8, 16, 30, 60 and 120) within 1286 areas (5×5 km) across the Brazilian Amazon. Interpolation adequacy was evaluated using root mean square error (RMSE) and correlations calculated from the interpolated values in relation to the original SRTM altitude values. Lines and shaded areas are mean values and 95% confidence intervals from GAM models illustrating trends with increasing sample size. The filled colors show the standard deviation (SD) of altitude values within each of the different sample areas.

