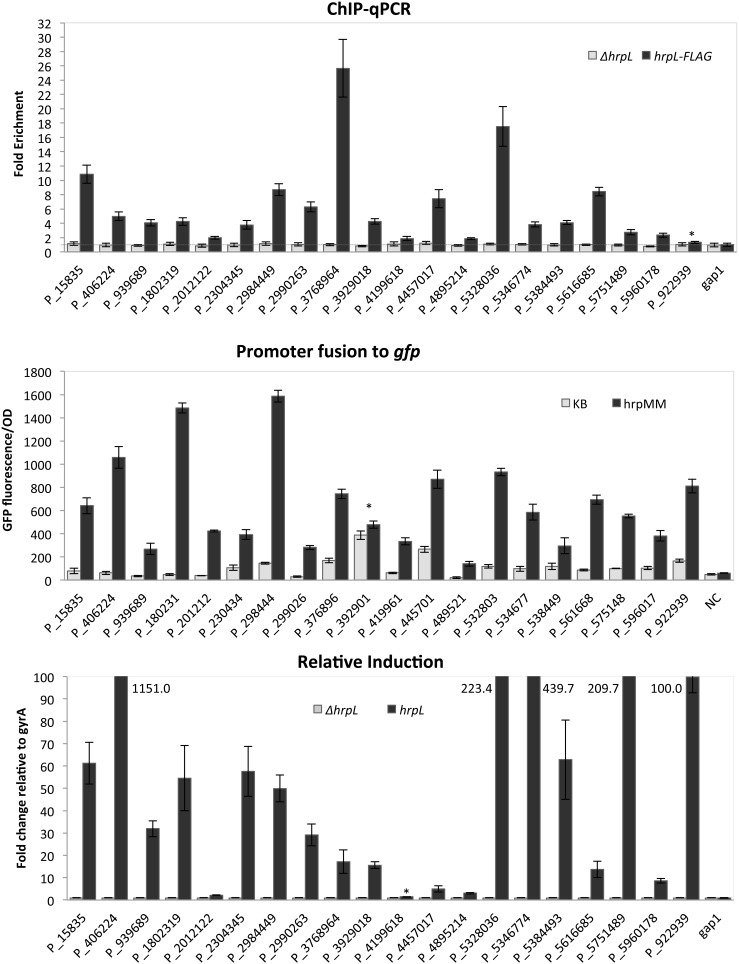
Figure 4. Validation of new hrp promoters.
(A). ChIP_qPCR experiments to test enrichment of DNA fragments at putative HrpL binding sites. Values for each gene were normalized to results for gyrA (DNA gyrase subunit A). gap-1 (glyceraldehyde 3-phosphate dehydrogenase, type I), not predicted to be HrpL-regulated, was used as a negative control. All fold changes above the expression value for gyrA are classified as enriched (above the horizontal line). (B). Induction of cloned hrp promoter-gfp fusions. Induction was measured by relative fluorescence normalized by OD600 (GFP fluorescence/OD) in hrp-inducing and hrp-repressing conditions. The hrp promoter::gfp fusion constructs were expressed in the DC3000 ΔpvsA siderophore mutant. The promoter trap vector without a promoter insert was used as a negative control (NC). GFP was measured using a Synergy 2 plate reader (Biotech) with excitation from 475 to 495 nm and emission from 506 to 526 nm. OD was measured at 600 nm using the same plate reader. A kinetics reading procedure was used, and a single data point at 5 hours was plotted for all strains, which is the time at which they show a peak value. (C). qRT-PCR analysis showing HrpL-dependent differential expression of transcripts downstream from hrp promoters in WT DC3000 and ΔhrpL strains. The relative fold change was measured after 1.5 hours on MG supplemented with iron (50 µM final concentration) normalized to gyrA. For determination of the relative expression, expression of each gene in the ΔhrpL mutant was set to 1. Expression of each gene in the WT strain was then normalized to the corresponding gene in the ΔhrpL mutant. All data points are the averages of 3 replicates with standard deviations.

