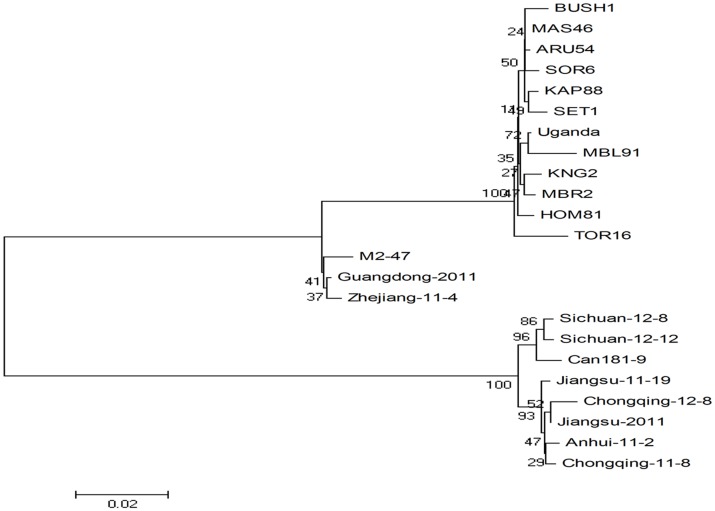
Figure 3. Phylogenetic tree based on partial sequences of RNA1.
Phylogenetic tree illustrating relationships between isolates obtained from China and representative isolates of sweet potato chlorotic stunt virus (SPCSV) deposited in GenBank. Neighbor-joining trees were constructed via the maximum composite likelihood substitution model using MEGA (version 4.0). Numbers at branches represent bootstrap values of 1000 replicates. The scale bar shows the number of nucleotide substitutions per site.

