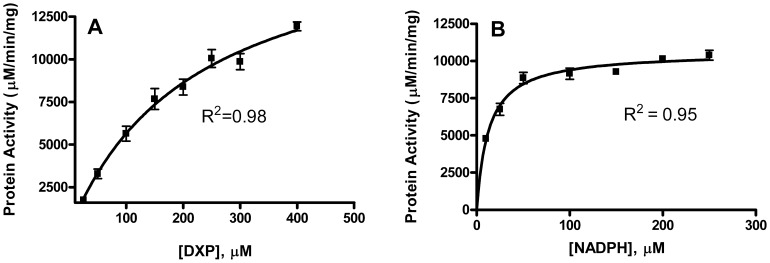
Figure 4. The substrate dependent catalytic activity of Y. pestis MEP synthase.
Shown are the Michaelis-Menten plots of reaction velocity as a function of A) DXP concentration and B) NADPH concentration. Least-squares best fit of the data to the Michaelis-Menten equation produces the kinetic parameters listed in Table 1. The R2 value for each plot is indicated. All assays were performed in duplicate.

