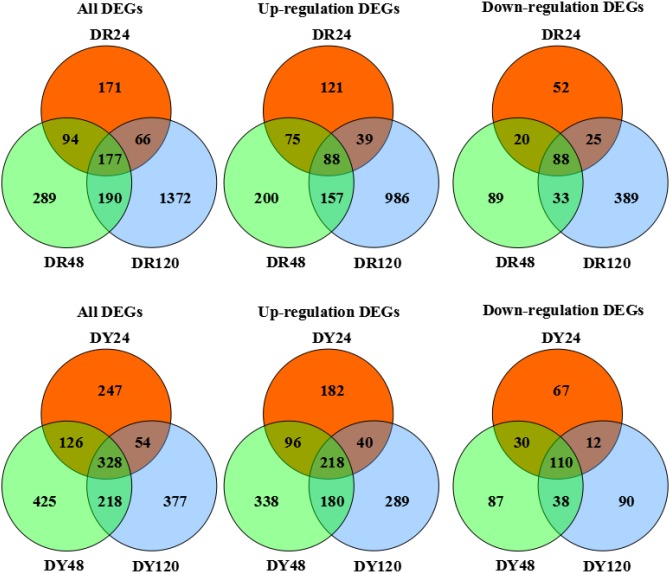
Figure 2. Venn diagram of differentially co-expressed genes in both sugarcane cultivar after S. scitamineum inoculation at different time points.
DR24, DR48 and DR120 denote differentially expressed gene sets obtained from “ROC”22 samples at 24, 48 and 120 h after S. scitamineum inoculation compared to control sample at 24 h after water inoculation, respectively; DY24, DY48 and DY120 denote differentially expressed gene sets obtained from Yacheng05-179 samples at 24, 48 and 120 h after S. scitamineum inoculation compared to control sample at 24 h after water inoculation, respectively; All DEGs, all differentially expressed genes; Up-regulation DEGs, up-regulated genes; Down-regulation DEGs, down-regulated genes.

