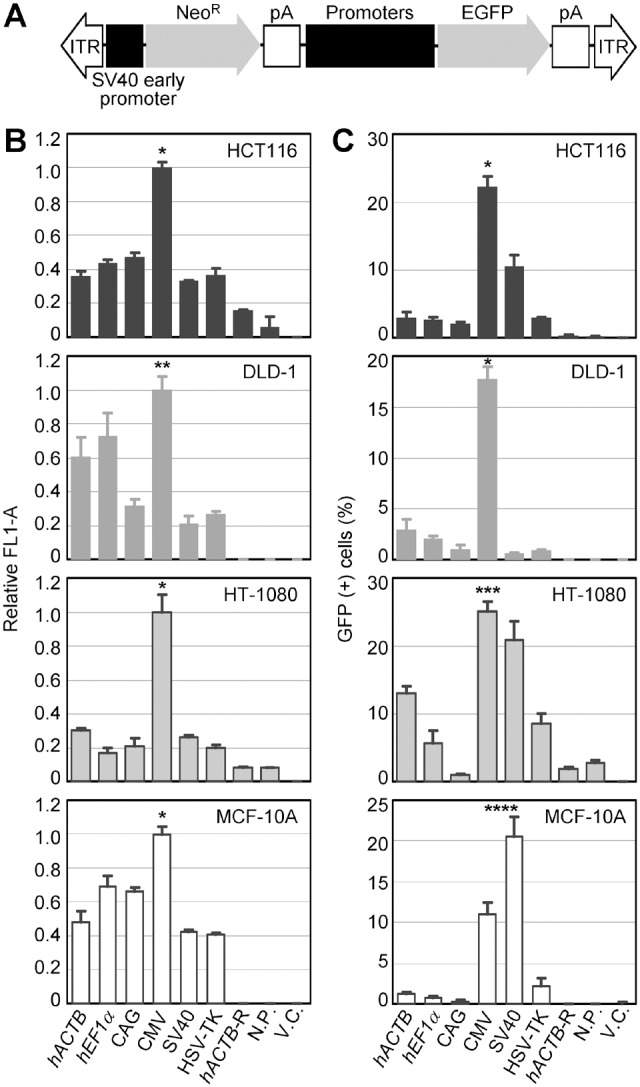
Figure 1. Transient GFP expression driven by various constitutive promoters in AAV vectors.

(A) Schematic representation of AAV vectors used for GFP assays. “Promoters” indicates the position where one of the six promoters was incorporated. ITR, inverted terminal repeat; SV40, simian virus 40; NeoR, neomycin phosphotransferase gene; pA, polyadenylation site; EGFP, enhanced GFP. The diagram is not drawn to scale. (B, C) Transient GFP expression in human cell lines. Cell lines denoted within bar graphs were infected with the AAV vectors shown in (A), and GFP signals were quantified by fluorescence FCM after 2-days incubation. Shown are mean GFP intensity (acquired as mean FL1-A) for each infectant relative to data obtained with the CMV promoter (B) and percentage of GFP positive cells within each infectant (C) (mean ± s.e.m.; n = 3). hACTB, human β-actin; hEF-1α, human elongation factor-1α; CAG, cytomegalovirus early enhancer/chicken β-actin; CMV, cytomegalovirus; HSV-TK, herpes simplex virus thymidine kinase; hACTB-R, hACTB reverse direction; N.P., no promoter; V.C., vector control. For V.C., an unrelated AAV vector harboring no EGFP gene was used. *Significantly higher than any of the other promoters and controls (p<0.001 for all pairs). **Significantly higher than CAG, SV40, HSV-TK, hACTB-R, N.P. and V.C. (p = 0.001 versus CAG; p<0.001 versus the others). ***Significantly higher than hACTB, hEF-1α, CAG, HSV-TK, hACTB-R, N.P. and V.C. (p = 0.004 versus hACTB; p<0.001 versus the others). ****The data for SV40 is the highest (p = 0.002 versus CMV; p<0.001 versus the others), and those for CMV is the second highest (p = 0.001 versus hACTB and hEF-1α; p = 0.003 versus HSV-TK; p<0.001 versus CAG, hACTB-R, N.P. and V.C) among the investigated promoters and controls. p-values were determined based on Scheffe’s post hoc test.
