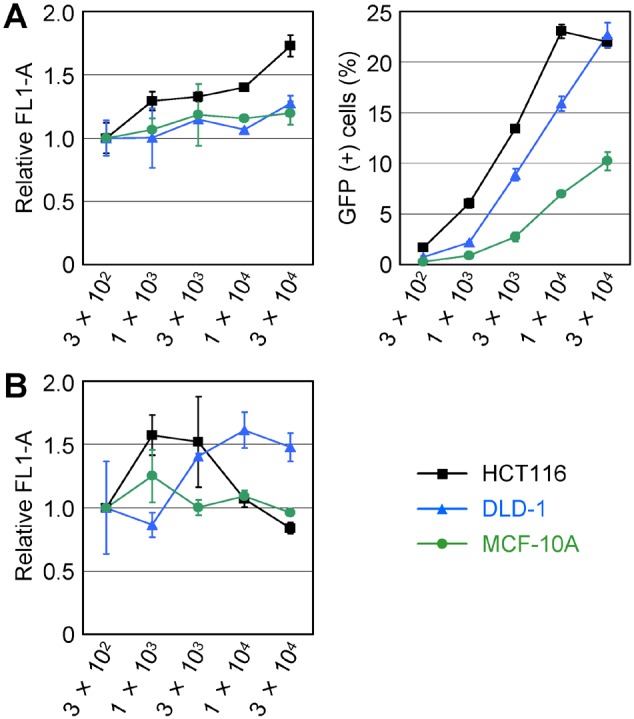
Figure 3. The impact of the MOI of an AAV vector on GFP expression level.

The HCT116, DLD-1, and MCF-10A cell lines were infected with various MOIs of an AAV vector expressing EGFP under the control of the CMV promoter, and GFP expression was quantified by fluorescence FCM (mean ± s.e.m.; n = 3). X-axes indicate MOIs of the AAV vector. (A) Fluorescence FCM analyses performed after two days of culture post-infection without G418. (left) Mean GFP intensities (acquired as mean FL1-A) for respective infectants are shown relative to the data obtained with the cells infected at an MOI of 3×10². (right) Percentage of GFP positive cells in each infectant. (B) Fluorescence FCM analyses performed after four weeks of culture post-infection in the presence of G418. Data are shown in the same manner with the left panel of (A).
