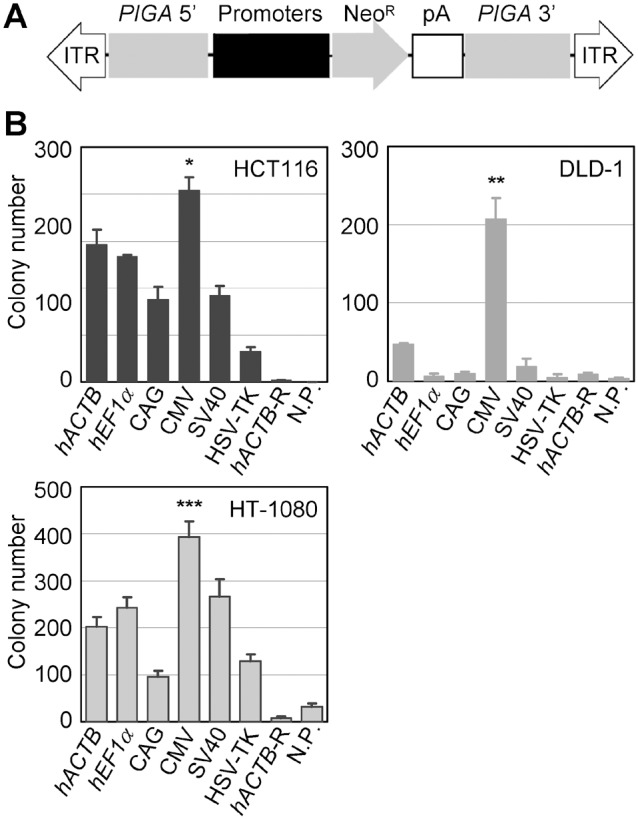
Figure 5. Formation of G418-resistant colonies by the infection of AAV vectors in which the NeoR gene is directed by various promoters.

(A) Schematic representation of AAV-based PIGA-targeting vectors used for assays shown in Figures 5B and 6A. PIGA 5′ and PIGA 3′ represent homology arms designed for the targeting of human PIGA gene. The diagram is not drawn to scale. (B) Numbers of G418-resistant colonies obtained by the infection of AAV vectors. The cell lines indicated in the graphs were infected with the AAV-based PIGA-targeting vectors depicted in (A) and selected with G418 until visible colonies were formed. Colonies were stained with crystal violet and then counted (mean ± s.e.m.; n = 3). For abbreviations, refer to legend for Figure 1. *Significantly higher than hEF-1α, CAG, SV40, HSV-TK, hACTB-R, and N.P. (p = 0.01 versus hEF-1α; p<0.001 versus the others). **Significantly higher than any of the other promoters and controls (p<0.001 for all pairs). ***Significantly higher than hACTB, hEF-1α, CAG, HSV-TK, hACTB-R, and N.P. (p = 0.003 versus hACTB; p = 0.02 versus hEF-1α; p<0.001 versus the others). p-values were determined based on Scheffe’s post hoc test.
