
Figure 10.
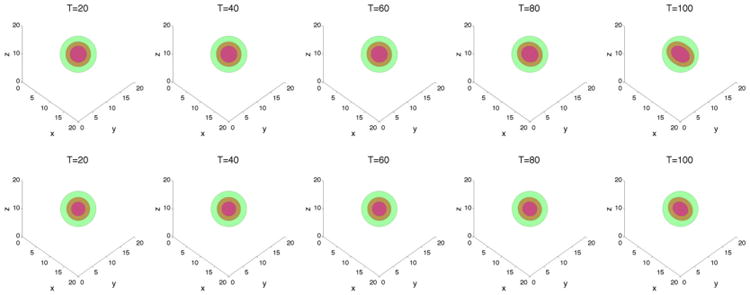
The membrane ϕ̃ = 0.5 surface (green) and the tumor ϕT = 0.5 surface (red) with large cell–cell adhesion γ = 0.2 and A = 4. The dead cells are located primarily within the magenta curve (ϕD = 0.5).Top: without feedback; bottom: with feedback.