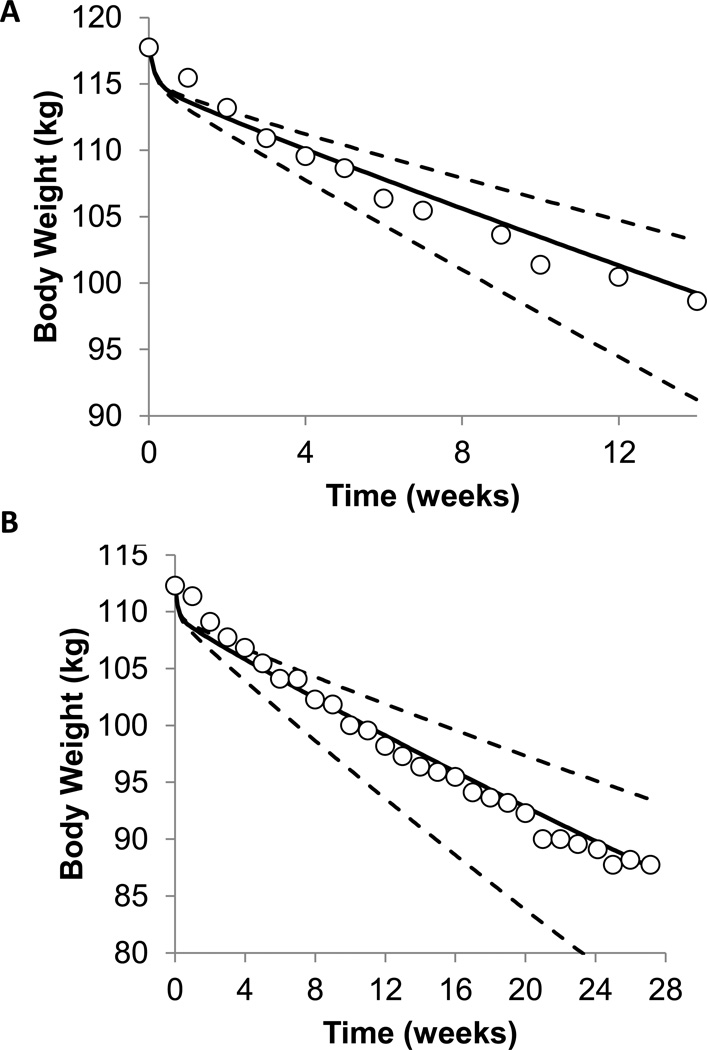
Figure 1.
(A) Model calculations (curves) along with the observed body weight time course (○) in (A) a sedentary 59 year old male with BMI of 34 kg/m2 and (B) a sedentary 50 year old female with BMI of 40 kg/m2 who were both participating in a medically-supervised, outpatient weight loss program. The solid curves are the model’s best estimate and the dashed curves illustrate the uncertainty in the model predictions based on uncertainties in an individual’s baseline energy requirements and changes in physical activity during the intervention.

