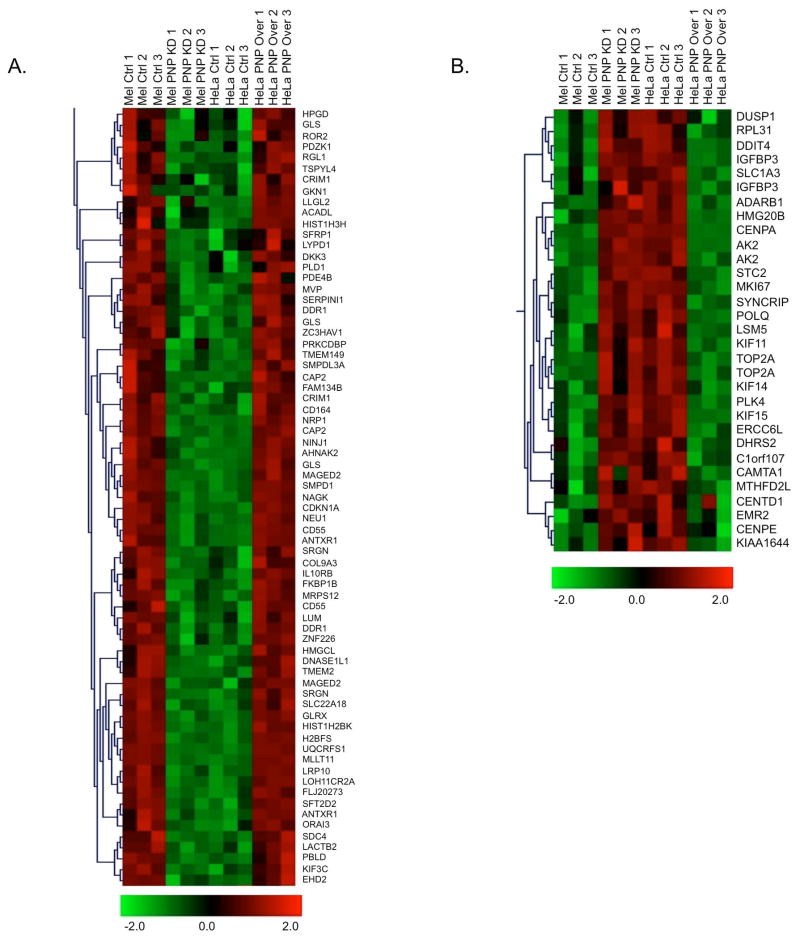
Figure 1. Comparison of hPNPaseold-35-induced changes in gene expression in HO-1 and HeLa cells.
Hierarchical clustering of hPNPaseold-35 positively (A) and negatively (B) correlating genes as identified by microarray analysis. Each column represents a single biological replicate and each row corresponds to a gene, with red and green representing high and low expression levels, respectively.

