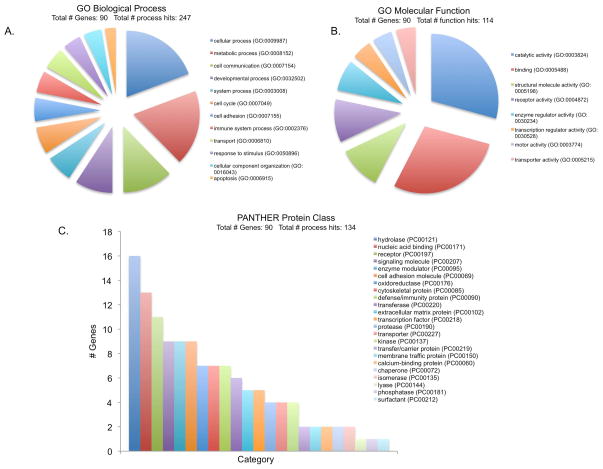
Figure 2. Gene Ontology (GO) terms for PNPase responsive genes.
GO analysis corresponding to Biological process (A), Molecular function (B) and PANTHER Protein class (C) represented as pie charts generated by PANTHER classification system (http://www.pantherdb.org/).

