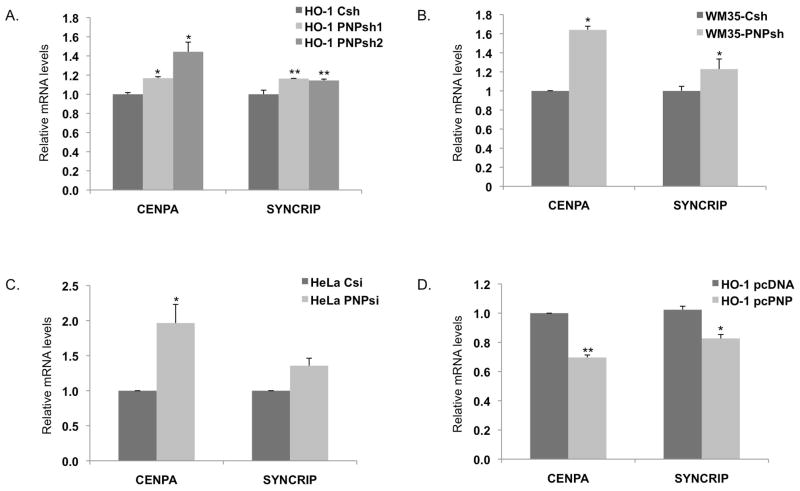
Figure 3. Real-time PCR validation of genes identified by microarray analysis.
(A) hPNPaseold-35–stable knockdown HO-1cells, (B) hPNPaseold-35–stable knockdown WM35 cells, (C) HeLa cells transiently transfected with siRNA against hPNPaseold-35 and (D) HO-1 cells transfected with pcDNA3.1-hPNPaseold-35. Error bars represent mean ± S.E. of three independent experiments done in triplicate. Statistical significance was determined by a one-way analysis of variance followed by Dunnett’s multiple comparison test and a two-tailed student’s t-test, *P<0.05, **P<0.01, ***P<0.001.

