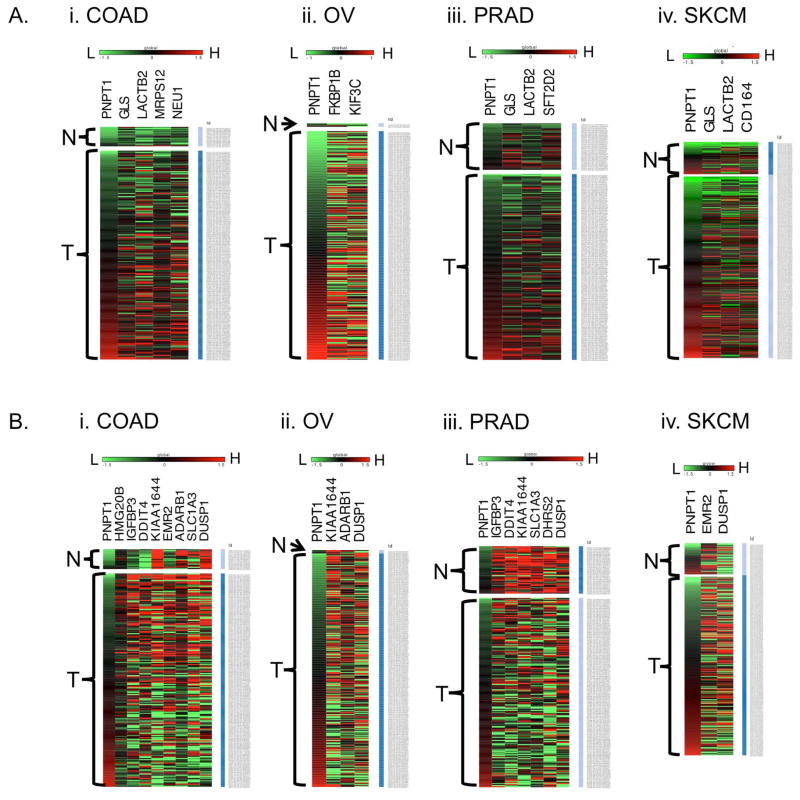
Figure 5. Heat maps representing correlations of hPNPaseold-35 responsive genes with hPNPaseold-35 in different tumor types identified using TCGA datasets.
Shown are the hPNPaseold-35 positively (A) and negatively (B) correlating genes in (i) colon adenocarcinoma (COAD), (ii) ovarian serous cyst adenocarcinoma (OV), (iii) prostate adenocarcinoma (PRAD), and (iv) skin cutaneous melanoma (SKCM), respectively. The samples are subdivided into solid normal (N) and primary tumor (T) groups, and arranged (top to bottom) in order of increasing (low=green to high=red) expression of PNPT1.

