
Figure 2.
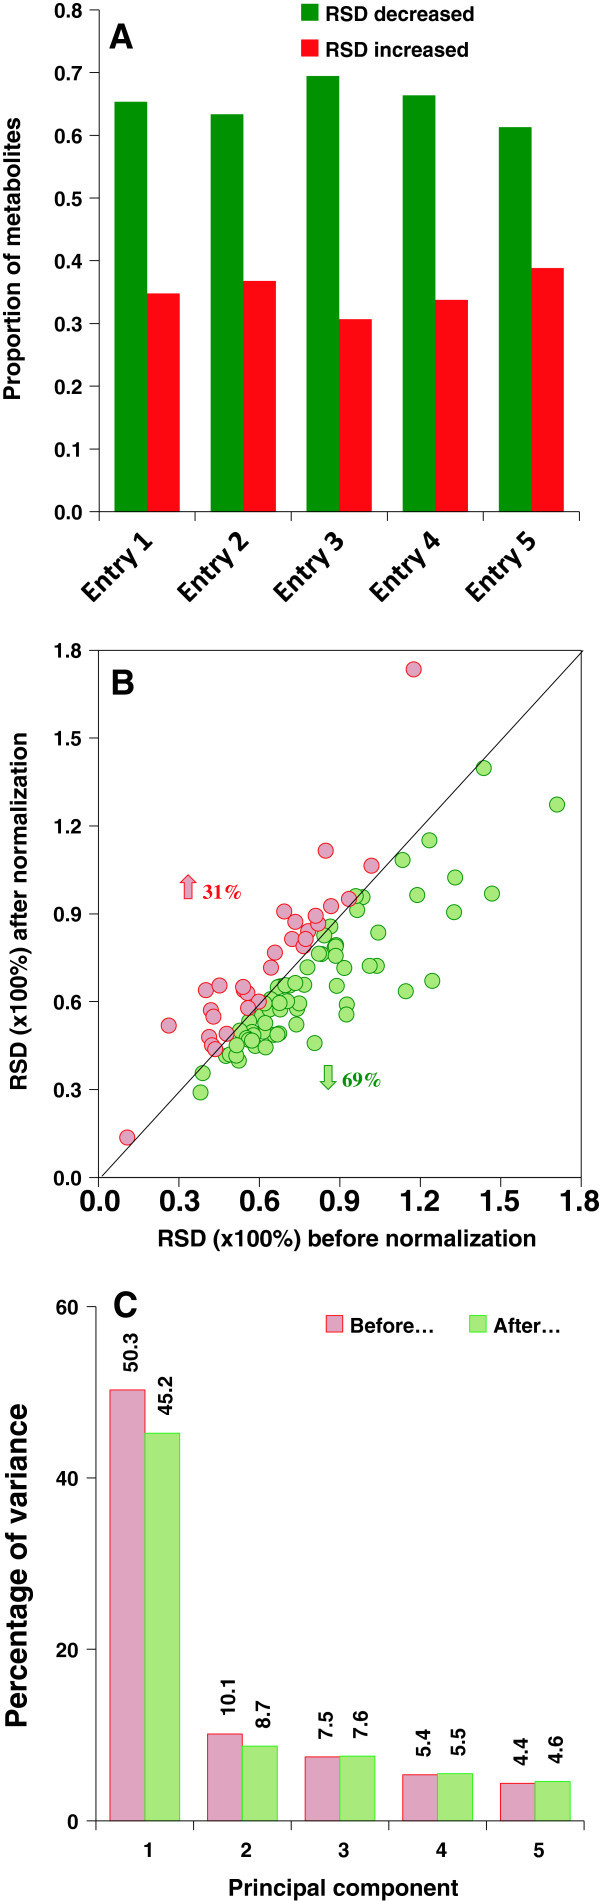
Data variability of test samples was reduced after normalization against reference samples. (A) Normalization against reference sample decreases the RSD of over 60% of metabolites in test samples (entries 1-5). (B) A scatter plot of RSD for 98 metabolites before and after normalization is shown for entry 3. The green dots (~69% of metabolites, below diagonal line) show decrease and red dots (~31%) show increase in RSD after normalization. (C) Normalization against reference sample decreases the percent variance of PC1 and PC2 (in PCA of entries 1-5) indicating that more components contribute after normalization.