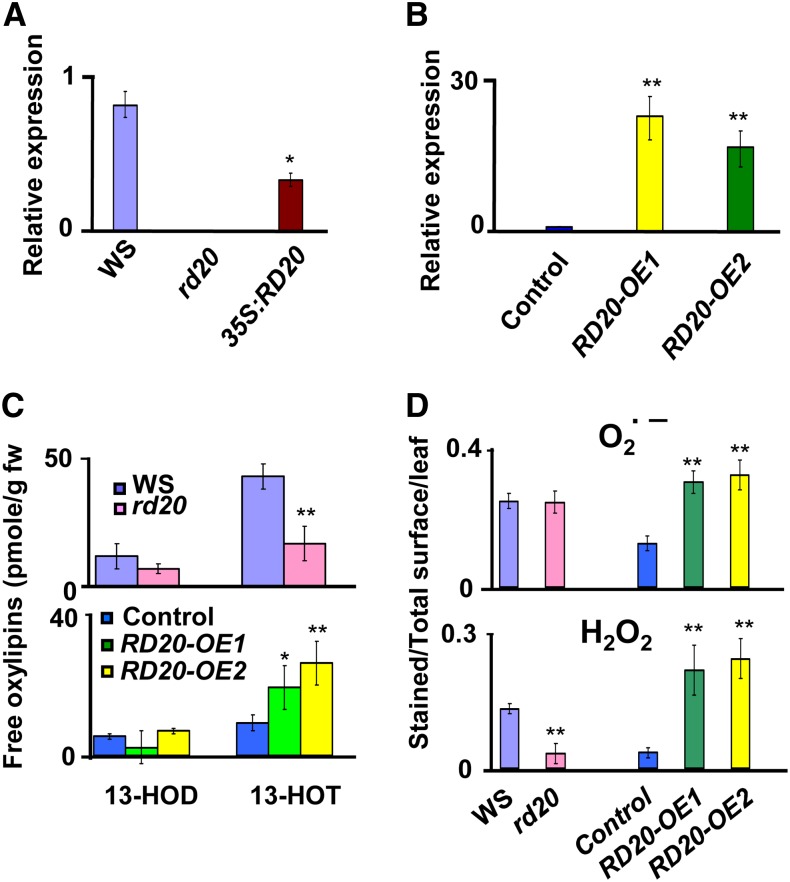
Figure 3.
Characterization of RD20 transgenic plants. A and B, qRT-PCR analysis of RD20 gene expression in 3-week-old leaves. A, RD20 was expressed in the rd20 background, yielding the 35S::RD20 line. B, The control contains an empty vector used for the overexpression of RD20. Data represent means and se of three replicates obtained from three different biological samples. C, Oxylipin profiling. Free FAOHs present in leaves of the different lines were analyzed by HPLC. All lines were harvested at the bolting stage of RD20-overexpressing plants. Data represent means and se of two replicates from 20 different biological samples. fw, Fresh weight. D, ROS status of 3-week-old rosette leaves. Superoxide radical (O2∙−) levels were determined after staining leaves with NBT (top), whereas H2O2 contents were measured by staining leaves with DAB (bottom). Ratios of stained surface versus total surface were calculated with ImageJ. For all parts, results concerning transgenic lines versus their respective controls were considered statistically different as indicated: **P < 0.01, *P < 0.05 (n ≥ 30 for each line; Student’s t test analysis).

