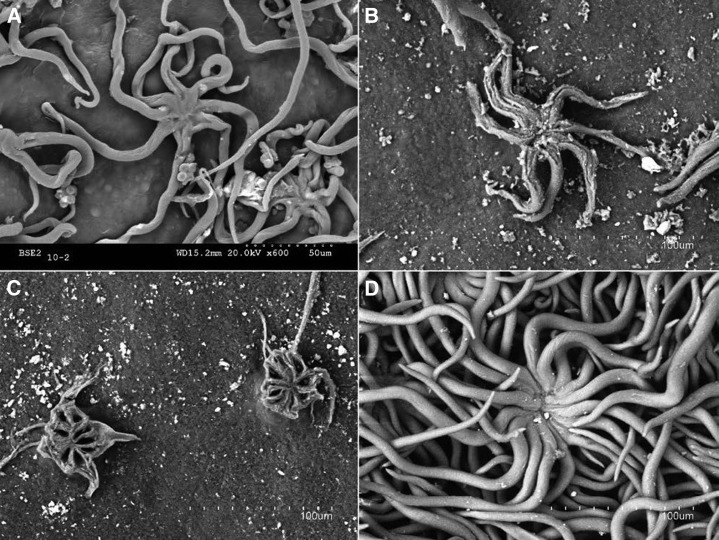
Figure 6.
Effect of cellulase hydrolysis on holm oak adaxial (A, B, and C) and abaxial (D) leaf surfaces. A, Intact, adaxial leaf surface. B, Adaxial leaf surface after 4 d in cellulase solution. C, Adaxial leaf surface after 7 d in cellulase solution. D, Abaxial leaf surface after 7 d in cellulase solution.

