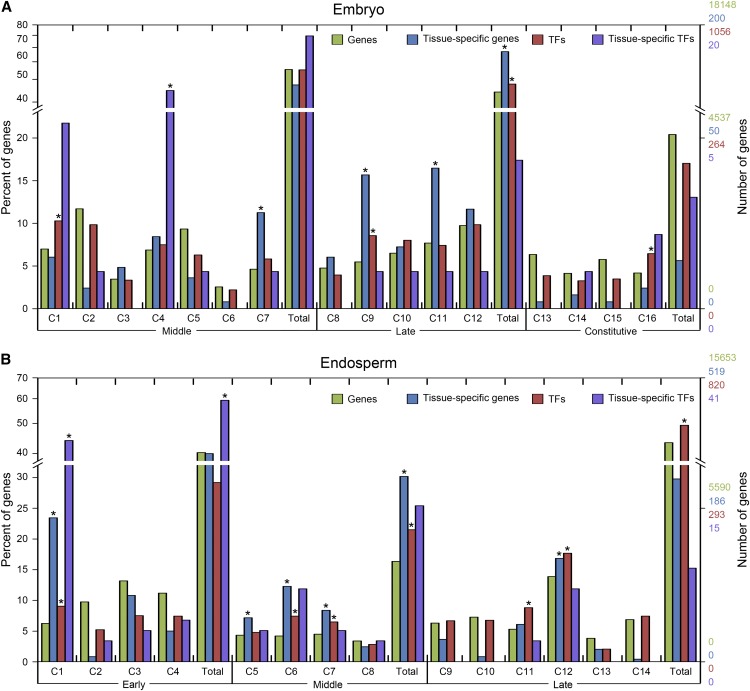
Figure 5.
Distribution and enrichment of genes, tissue-specific genes, TFs, and tissue-specific TFs in coexpression modules of embryo and endosperm. A and B, Bars indicate the percentage of all detected genes (green), tissue-specific genes (blue), TFs (red), and tissue-specific TFs (purple) observed in a coexpression module (C) or in the development phase (Total) relative to the total number of each group detected across samples for embryo (A) and endosperm (B). The number of genes represented by the percentage is shown on the right y axis. Enrichment for tissue-specific genes and TFs was evaluated with Fisher’s exact test based on the number of genes observed in each coexpression module, whereas enrichment for tissue-specific TFs was evaluated based on the number of TFs observed in each coexpression module. Asterisks represent significant enrichment at a false discovery rate ≤ 0.05.

