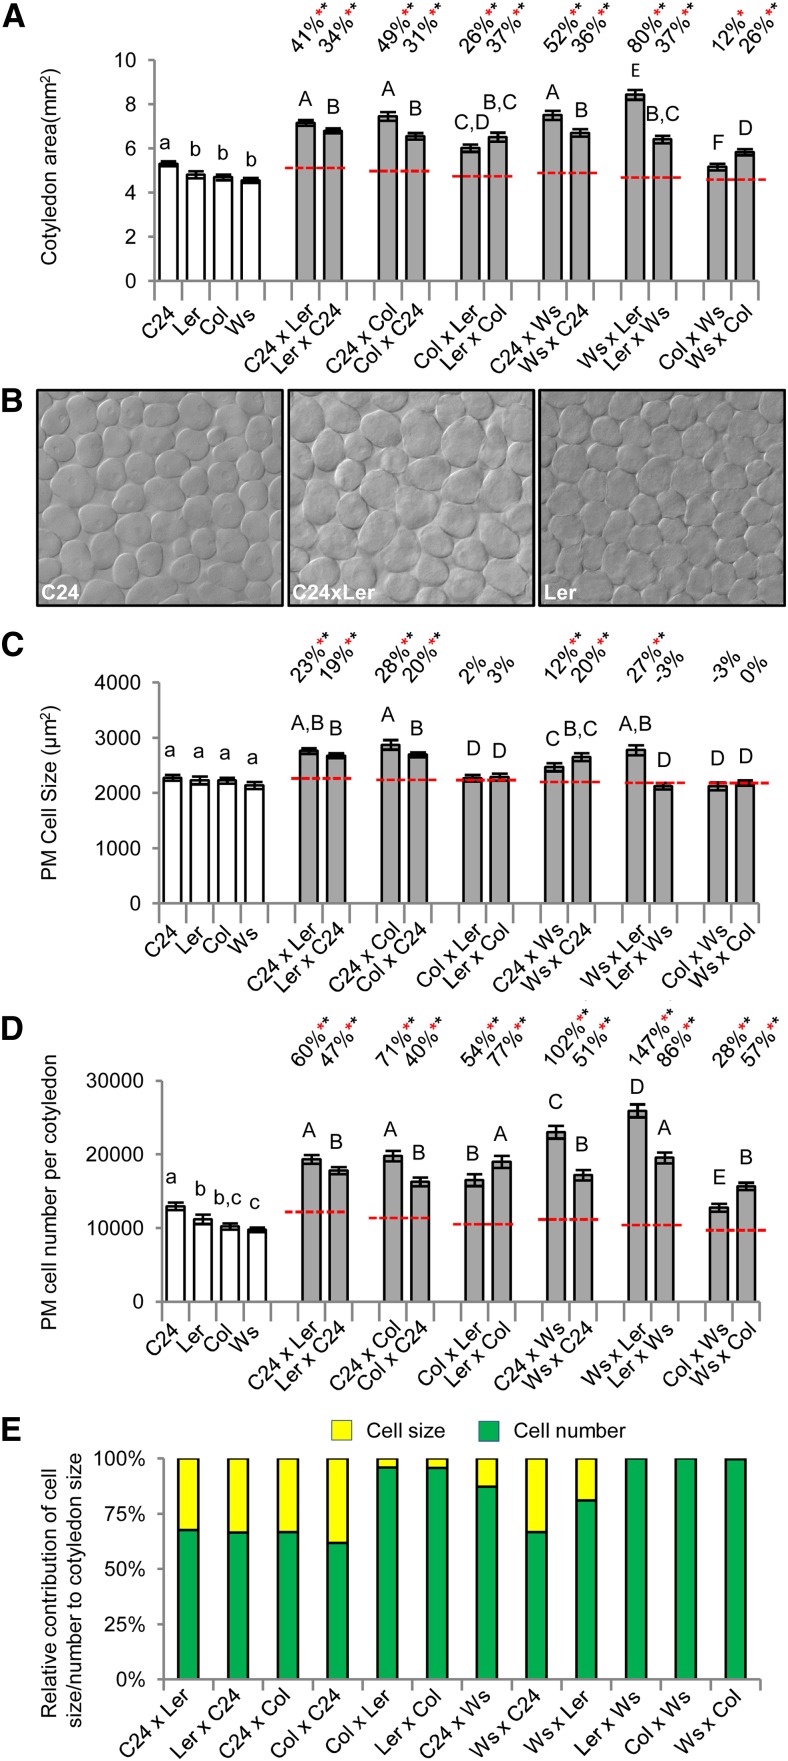
Figure 2.
Measurements of heterosis in cotyledons of 7-DAS hybrid seedlings. A, Cotyledon area in most hybrids exceeds BPV. B, Paradermal optical sections of the PM layer showing the larger cells of the C24xLer hybrid. C and D, Measurements of PM cell size and estimated cell number in the cotyledons. E, Relative contribution of the increases in cell size and cell number to the larger cotyledons of the hybrid. Percentages above bars are levels from MPV (red dashed line). Red asterisks indicate significant differences from MPV, and black asterisks indicate above BPV (Student's t test P < 0.01). Statistical comparisons among the hybrids (uppercase letters) and among the parents (lowercase letters) are shown, and categories with different letters are statistically different from the others (Student's t test P < 0.01). All error bars are sem. n = 40 to 136 (Supplemental Table S11).

