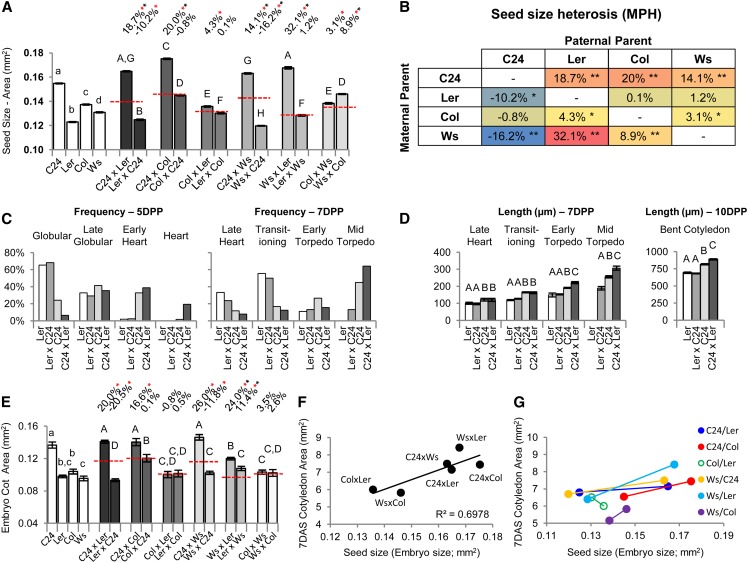
Figure 5.
Measurements of heterosis during the embryogenic phase. A, Seed size measurements as an indication of mature embryo heterosis. B, Levels of seed size heterosis (proxy for embryo heterosis) for the different parental combinations. Values are levels compared with MPV (Student's t test P < 0.01), shaded in a heat-map format; blue is the lowest value, and red is the highest value. *, Different from MPV. **, Above BPV or below low parent value. C, Rate of embryo development as indicated by a frequency distribution of embryos examined at 5 and 7 DPP and their developmental stage (depictions of developmental stages are in Supplemental Fig. S6A). D, Size of embryos at given developmental stages. Lettering indicates statistical comparisons between categories (Student's t test P < 0.01; 5 DPP in Supplemental Fig. S6B). E, Embryonic cotyledon area. F, Positive correlation between embryo size and cotyledon area. G, Relationship among reciprocal combinations between embryo size and cotyledon area showing that the reciprocal combination producing the larger embryo produces the larger cotyledons. Solid circles indicate significant difference in cotyledon area between reciprocal combinations (Fig. 2A). Percentages above bars are levels from MPV (red dashed line). Red asterisks indicate significant differences from MPV, and black asterisks indicate above BPV (Student's t test P < 0.01). Statistical comparisons among the hybrids (uppercase letters) and among the parents (lowercase letters) are shown (Student's t test P < 0.01). All error bars are sem. n = 201 to 1,242 in A, n = 39 to 101 in C and D, and n = 14 to 22 in E (Supplemental Table S11).

