Figure 1.
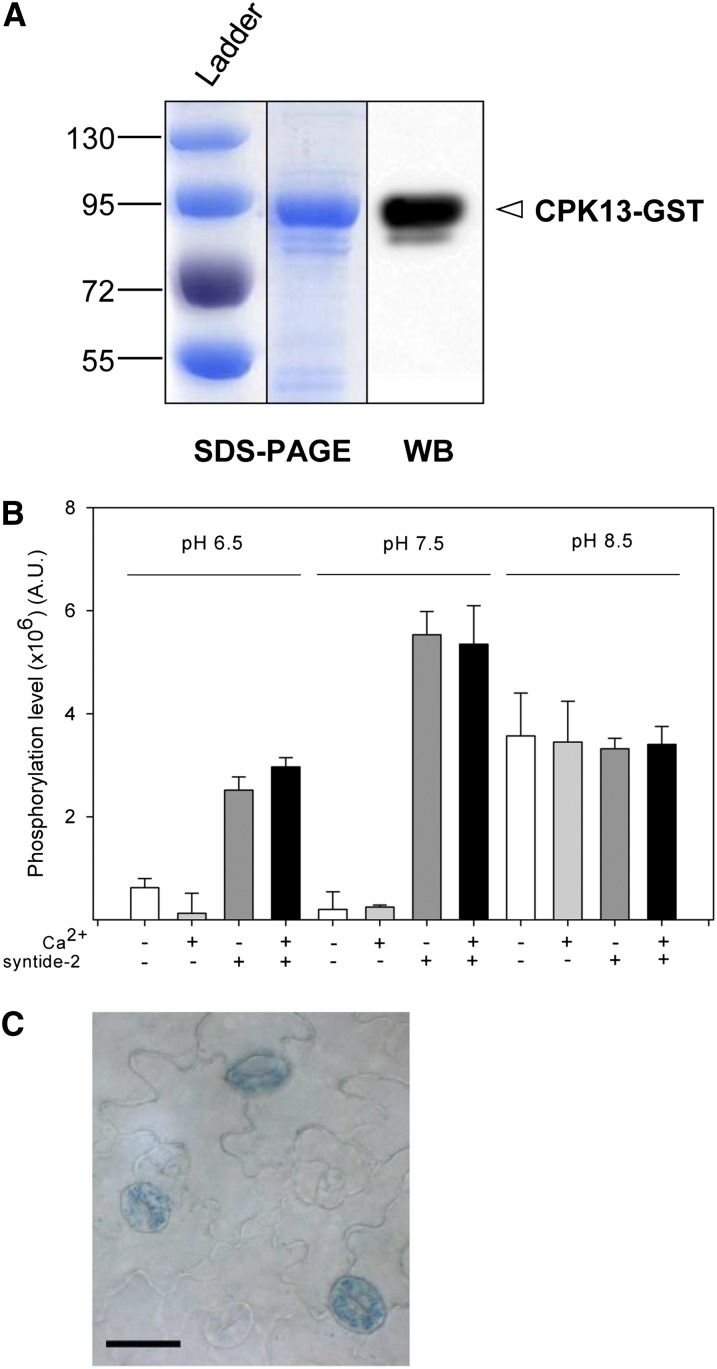
CPK13 expression pattern and biochemical assays. A, Coomassie Blue staining of an SDS-PAGE gel (left) and western-blot autoradiography (WB; right) showing a major band corresponding to the CPK13-GST fusion protein purified from the Rosetta E. coli strain (see “Materials and Methods”). B, In vitro phosphorylation activity of recombinant CPK13 kinase. Kinase activity (arbitrary units [A.U.]) of CPK13 (10 ng µL−1) in 15 min was measured either in the presence of 10 µm free Ca2+ or in the absence of Ca2+ and in the presence of 25 µm syntide-2 as a control target peptide (assay of both autophosphorylation and transphosphorylation) or in the absence of syntide-2 (assay of sole autophosphorylation). Buffers of three pH values were used: 6.5, 7.5, and 8.5. Data are shown as means ± se (n = 3). C, Spatial expression pattern of CPK13 in Arabidopsis leaf (partial view of an adaxial surface) is shown in guard cells, using the GUS gene as a reporter of CPK13 promoter activity. Bar = 20 µm. [See online article for color version of this figure.]

