Figure 6.
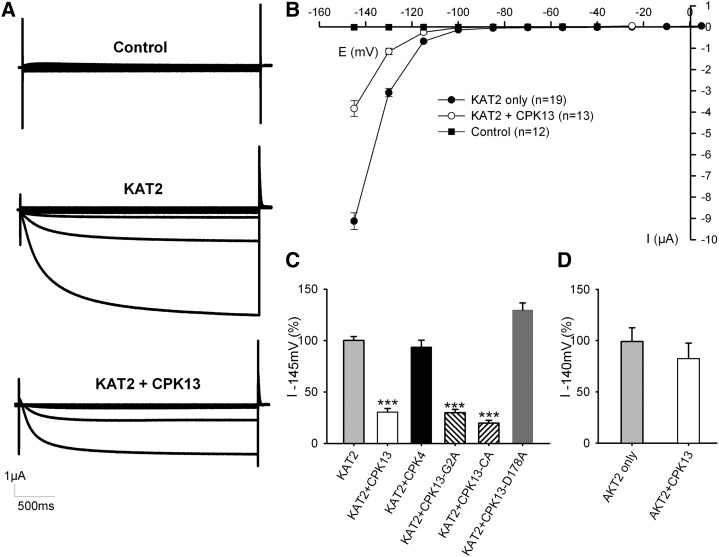
Inhibition of KAT2 channels by CPK13 in X. laevis oocytes. A, Representative current recordings obtained in noninjected oocytes (control; top) or in oocytes injected with KAT2 cRNA (KAT2; middle) or with KAT2 + CPK13 cRNAs (KAT2 + CPK13; bottom) using TEVC. In all recordings, 3-s voltage steps to values ranging between +5 and −145 mV in −15-mV decrements were applied from a −40-mV holding potential. B, Average current-voltage relationships from recordings obtained in the same conditions as in A. Data are means ± se for noninjected oocytes (black squares; n = 12) and oocytes injected with either KAT2 cRNA (black circles; n = 19) or KAT2 + CPK13 cRNAs (white circles; n = 13). C, Comparative effects on KAT2 of CPK13, CPK4, CPK13-G2A (nonmyristoylated mutant CPK13), CPK13-CA (constitutively active mutant CPK13; see text), and CPK13-D178A (mutant CPK13 devoid of kinase activity). The bar chart represents the current recorded at −145 mV in oocytes expressing KAT2 with a kinase as a percentage of current recorded at −145 mV in oocytes expressing KAT2 only within the same experiment. Data are means ± se from two or three independent experiments with n = 53 for KAT2, n = 40 for KAT2 + CPK13, n = 8 for KAT2 + CPK4, n = 30 for KAT2 + CPK13-G2A, n = 18 for KAT2 + CPK13-CA, and n = 20 for KAT2 + CPK13-D178A. ***P ≤ 0.001 by Student’s t test. D, Effect of CPK13 on AKT2. The bar chart represents the current recorded at −140 mV for oocytes expressing AKT2 only (n = 10) or AKT2 + CPK13 (n = 8). Data are means ± se.

