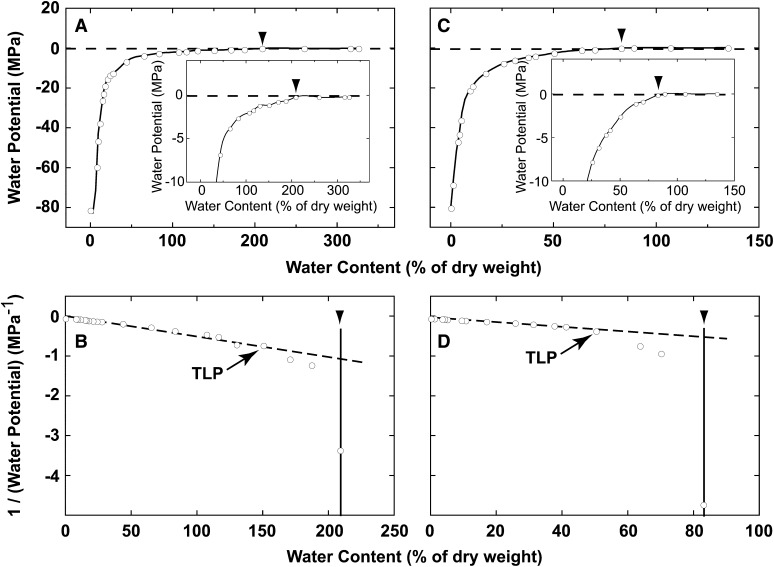
Figure 6.
Changes in water potential during dehydration of C. subflaccidum (A and B) and R. yasudae (C and D). Reciprocals of calculated ideal water potential values were plotted against the relative amount of water remaining in the colonies (B and D). Arrowheads indicate the initiation of the decrease in water potential. TLP, Turgor loss point (estimated according to the graph).

