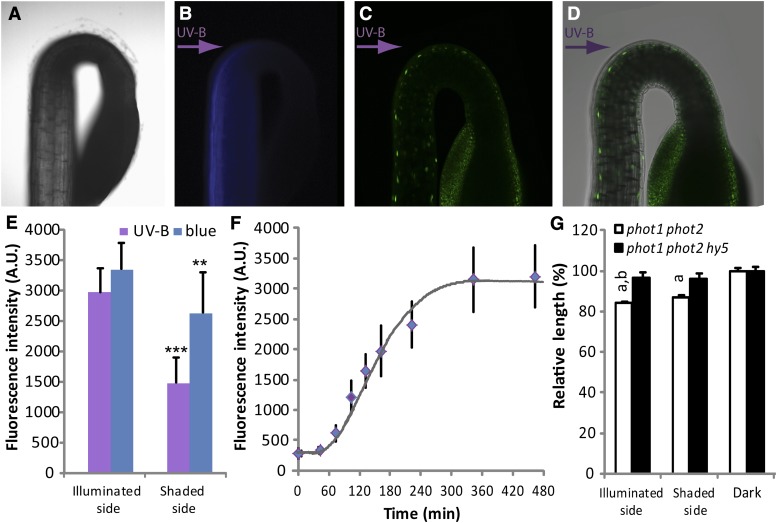
Figure 2.
UV-B-induced accumulation of HY5. A, Bright-field image of the top of a 2-d-old etiolated phot1 phot2 seedling. B, Blue fluorescence in the seedling (as in A) illuminated with monochromatic UV-B (0.12 µmol m–2 s–1 of 306 nm from the left). The seedling was stained in 100 µm umbelliferone in water, rinsed three times, mounted on a cover slip, and imaged using a Zeiss Axiovert microscope, while being exposed to unilateral UV-B. C, Confocal laser-scanning microscopic (Nikon EZC1) image from a phot1 phot2 seedling containing the pHY5::HY5-YFP construct. The seedling was grown for 2 d in darkness and then exposed to unilateral monochromatic UV-B (0.12 µmol m–2 s–1 of 302 nm, from the left) for 270 min. Nuclear HY5-YFP accumulation is visible as bright green spots. D, Confocal laser-scanning microscopic image, as in C, with differential interference contrast image overlay. E, Quantification of fluorescence in populations of seedlings grown as in C. Unilateral light was either 0.12 µmol m–2 s–1 of 302 nm (UV-B) or 450 nm (blue). Imaging was completed within 10 min after harvesting. Fluorescence intensity in nuclei of epidermal cells in the growth zone was measured at the illuminated and the shaded side using Nikon Instruments elements Advanced Research analysis software. Error bars indicate sd on fluorescence from different seedlings (n > 10). Statistical significance versus illuminated side: **P < 0.01, ***P < 0.001. F, Kinetic analysis of HY5-YFP accumulation upon unilateral UV-B illumination (0.12 µmol m–2 s–1 of 302 nm) in 2-d-old etiolated phot1 phot2 pHY5::HY5-YFP seedlings during the first 8 h after exposure. Fluorescence measurement was done as in D, using fixed acquisition settings of the 480-min sample, which was adjusted to yield values just under saturation. Error bars indicate sd on fluorescence from different seedlings (n > 5). G, Seedlings were grown for 2 d in darkness and then exposed to 18 h of unilateral monochromatic UV-B (0.12 µmol m–2 s–1 of 302 nm) or kept in darkness. Photographs were taken, and hypocotyl length was measured using ImageJ software. Data were normalized to the length of dark-grown seedlings. a, significant (P < 0.05) difference with dark control; b, significant (P < 0.05) difference with the length of the shaded side. Error bars represent se of the mean (n ≥ 25).

