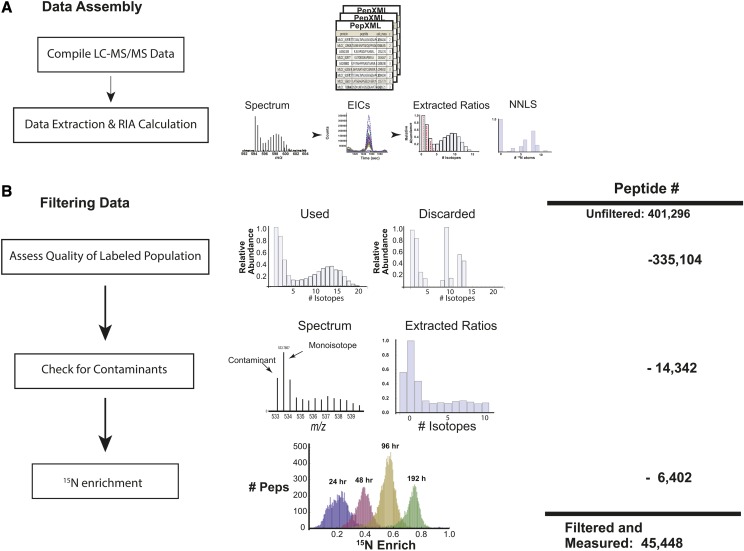
Figure 2.
Workflow for processing of MS data. A, LC-MS data sets from all time points were compiled, and a list of proteotypic peptides characterized using mass, retention time, charge state, and gel fraction number was made. EICs were generated for isotopes of each peptide, the EICs were used to calculate RIA at each time point, and these values were used to calculate labeled and unlabeled populations via a nonnegative least-squares regression (NNLS). B, To reduce error in turnover calculations, a series of filters were applied to peptide level calculations. Peptide measurements were filtered first on the characteristics of measured isotopic ratios, such as the number of measurable ratios and their distribution. These filters are described more thoroughly in Supplemental Methods S1. Measurements not meeting these criteria were discarded. Shown are representative data that were kept and discarded. As a second filter, we measured the value of the isotope 1 D lighter (minus one peak) than the monoisotopic mass. If the ratio of the monoisotope to this minus one peak was less than 5:1, the measurement was discarded, as this was a good indicator of overlapping and contaminating peptides. As a third filter, we assessed 15N enrichment for all peptides from a given time point, and all peptides that fell outside 2 sd of the distribution were removed, as we found that these peptides were of low quality. Shown are 15N enrichment levels for peptides at 24, 48, 72, and 96 h. At the right is the total number of possible quantitation events across all experiments. Listed beside each filter is the number of quantitation events that were removed by the respective filter, with the final number of successful quantitation events listed below.

