Figure 3.
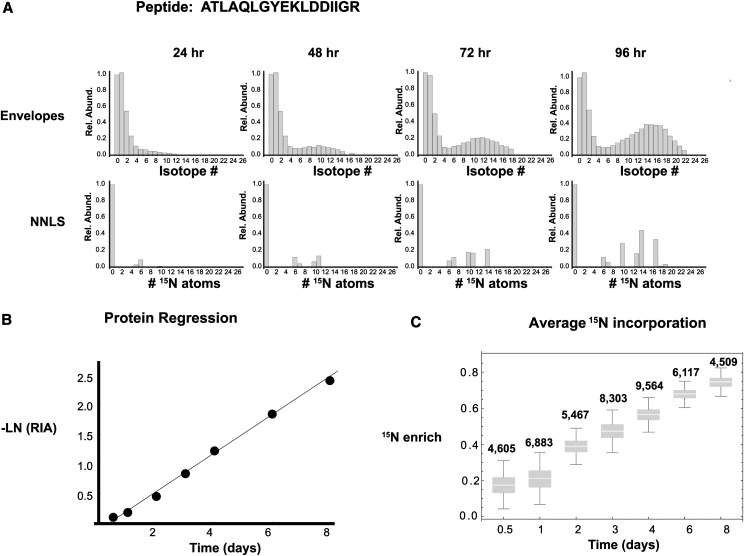
Example of protein turnover calculation. A, Top row, the isotopic envelope represented as isotopic ratios for the peptide ATLAQLGYEKLDDIIGR from Fd-GOGAT (MLOC_70866.1), at 24, 48, 72, and 96 h, with all isotopes normalized to the monoisotopic value. Bottom row, as determined by nonnegative least squares (NNLS), the NA form of the peptide, containing zero labeled 15N atoms, and the H form of the peptide, containing one or more 15N atoms. The RIA can then be measured as NA/(NA + H). B, The inverse of the natural log (−LN) of RIA for all time points for the protein was used to determine a degradation rate for the protein. C, Average 15N enrichment of labeled peptide populations at different time points through the course of the experiment.

