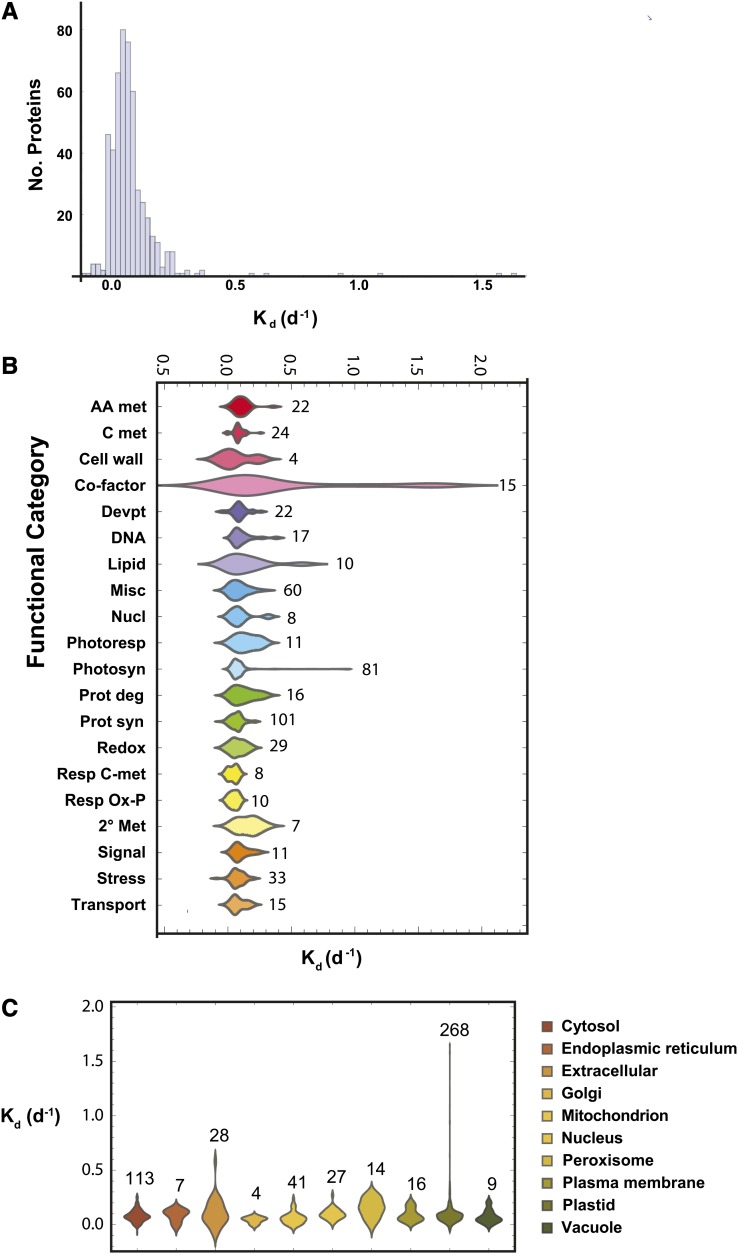
Figure 4.
A, Histogram of observed degradation rates. Values ranged over more than 2 orders of magnitude, with a median Kd of 0.08 d−1. B, Distribution of degradation rates for different protein functional categories. Using best BLAST matches from Arabidopsis, barley proteins were sorted into categories based on searches of the MapCave Web site (http://mapman.gabipd.org/web/guest/mapcave). The number of proteins in each category is marked to the right of each population. AA met, Amino acid metabolism; C met, carbon metabolism; Cell wall, cell wall metabolism; Co-factor, cofactor synthesis; Devpt, development and cellular organization; DNA, DNA and RNA metabolism; Lipid, lipid metabolism; Misc, miscellaneous; Nucl, nucleotide metabolism, Photoresp, photorespiration; Photosyn, photosynthesis; Prot deg, protein degradation; Prot syn, protein synthesis and assembly; Redox, redox metabolism; Resp C-met, respiratory carbon metabolism; Resp Ox-P, respiratory oxidative phosphorylation; 2° Met, secondary metabolism; Signal, signaling; Stress, stress response. C, Localizations were determined for Arabidopsis BLAST matches using the Suba Web site (http://suba.plantenergy.uwa.edu.au/), and organellar populations were plotted. The number of observed proteins for each organelle is marked above.

