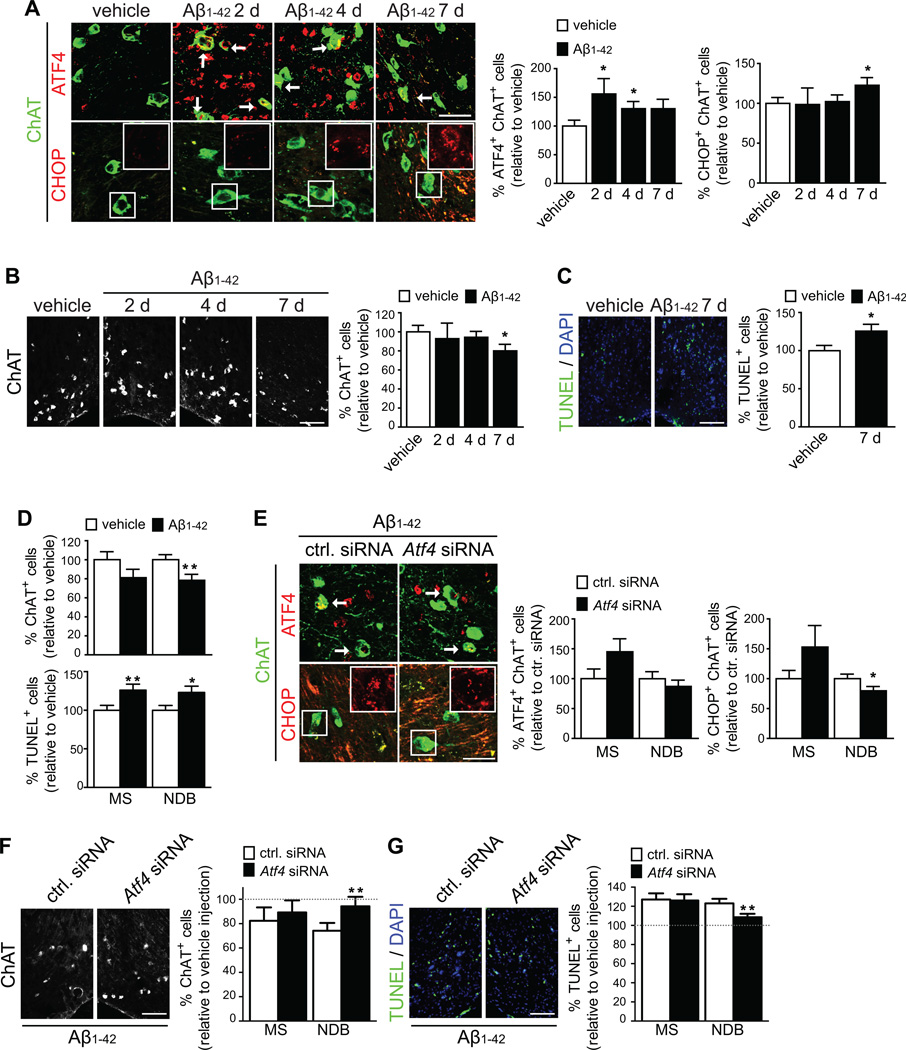
Figure 6. Intra-axonal synthesis of ATF4 leads to neurodegeneration in the adult mouse brain.
(A) Mice were injected with vehicle in the left hemisphere of the brain and with Aβ1–42 in the contralateral hemisphere. Sections of the basal forebrain were immunostained for ChAT and ATF4 or CHOP 2 to 7 DPI. Mean ±SEM of positive cells relative to vehicle in ~8 brain slices per animal (n=4–5 mice per condition). *p<0.05. Scale bar, 50 µm.
(B) ChAT-positive neurons in the basal forebrain of injected mice. Mean ±SEM of ChAT-positive neurons relative to the vehicle injected side in ~8 brain slices per animal (n=4–5 mice per condition). *p<0.05. Scale bar, 100 µm.
(C) TUNEL-positive cells in the basal forebrain of injected mice 7 DPI. Mean ±SEM of TUNEL-positive cells relative to the vehicle injected side in ~8 brain slices per mouse (n=5 mice). *p<0.05. Scale bar, 100 µm.
(D) Comparison of the effect of Aβ1–42 injection on ChAT- and TUNEL-positive cells in the MS and NDB 7 DPI. Mean ±SEM of positive cells in ~8 brain slices per mouse (n=5 mice). *p<0.05; **p<0.01.
(E) Aβ1–42 injections were performed in both hemispheres of the brain. A control (ctrl.) siRNA was co-injected into the left hemisphere and an Atf4 siRNA was co-injected in the right hemisphere. Basal forebrain sections were immunostained for CHAT and ATF4 or CHOP. ATF4- and CHOP-positive cholinergic neurons were quantified in the MS and NDB. Mean ±SEM of double-positive cells relative to ctrl. siRNA in ~8 brain sections per animal (n=5 mice). *p<0.05. Scale bar, 50 µm.
(F) Mice were injected as in E. ChAT-positive neurons in the basal forebrain of injected mice were quantified in the MS and NDB. Mean ±SEM of ChAT-positive neurons relative to ctrl. siRNA in ~8 brain slices per animal (n=5 mice per condition). **p<0.01. Scale bar, 100 µm.
(G) TUNEL-positive cells in the forebrain of injected mice. Mean ±SEM of TUNEL-positive cells relative to ctrl. siRNA in ~8 brain slices per mouse (n=5 mice). **p<0.01. Scale bar, 100 µm.
See also Figure S6 and Supplemental Table S2.

