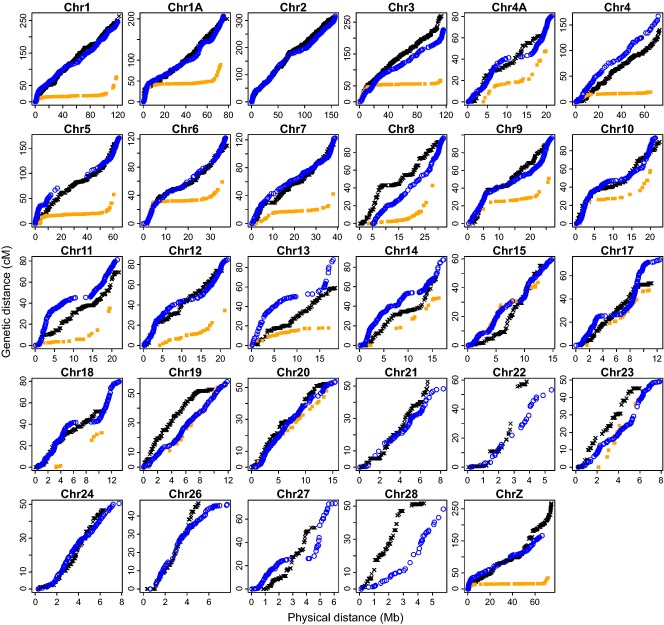
Fig. 8.
The relationship between the genetic (cm) and the physical (Mb) distance in the best-order map of the collared flycatcher genome (blue circle, this study), zebra finch (orange square, Backström et al. 2010a) and chicken (black cross, Groenen et al. 2009). For comparison purposes, chromosomes 1 and 4 in chicken were split into two chromosomes, corresponding, respectively, to chromosomes 1 and 1A, and chromosomes 4 and 4A, based on the zebra finch genome. Data were not available for chromosomes 2, 21, 22, 24, 26, 27 and 28 in zebra finch.

