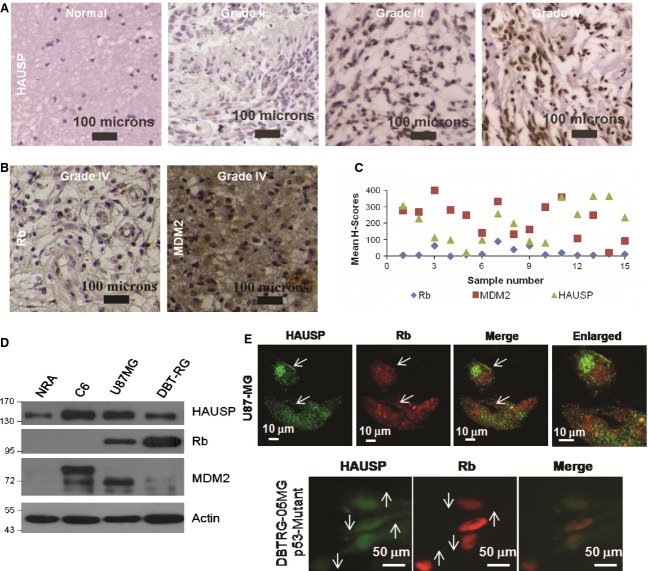
Fig. 5.
Differential regulation of Rb in glioma. (A) IHC of human glioma patient samples for HAUSP expression. Data show representative images of each grade at 10 × optical magnification (n = 38). (B) IHC of a subset of the above glioma samples for Rb and MDM2 expression. Data show representative images at 10 × optical magnification (n = 15). (C) Dot plot representation of the mean H-scores calculated for each sample to estimate the overall levels of expression of HAUSP, MDM2 and Rb (n = 15). (D) WB of HAUSP, MDM2 and Rb in NRA versus C6 rat glioma and other human glioma cell lines. (E) Confocal images of GBM cell lines U87MG (upper panel) and DBTRG-05MG (lower panel) (from ICC) showing a comparison of HAUSP and Rb expression. Images were taken at 60 × optical magnification and scale bars are marked.

