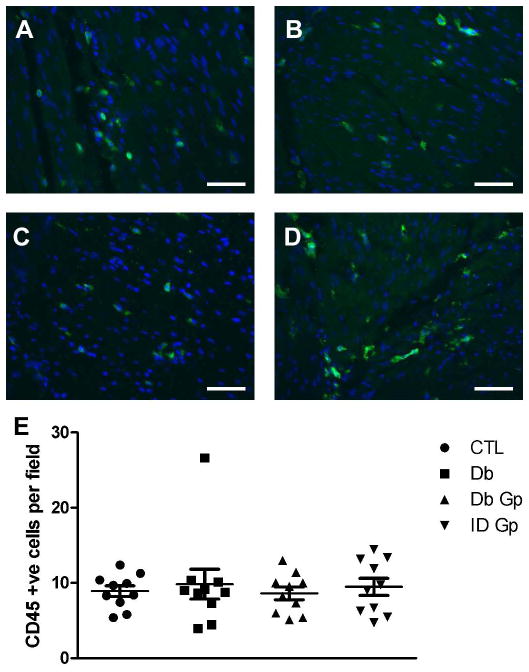
Figure 2.
Representative images for CD45 immunoreactivity in the gastric circular muscle layer from (A) Control (B) Diabetic Control (C) Idiopathic Gastroparesis (D) Diabetic Gastroparesis Scale bar = 100μM (E) Number of CD45 positive cells was not different between the four groups. Data show average values for counts from 39 fields from each patient as points, population means ± SEM shown whiskers, n = 10 patients for each group, P >0.05, One way ANOVA.

