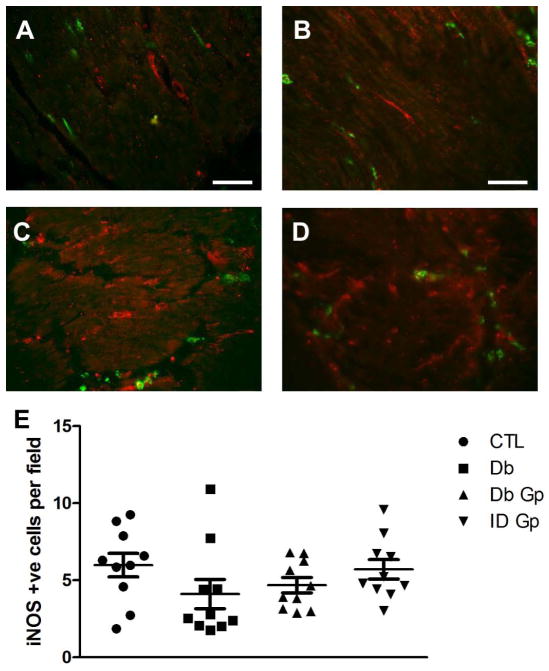
Figure 7.
Representative images for iNOS immunoreactivity in the gastric circular muscle layer from (A) Control (B) Diabetic Control (C) Idiopathic Gastroparesis (D) Diabetic Gastroparesis. (E) Number of iNOS positive cells is not different between the four groups. Data show average values for counts from 39 fields from each patient as points, population means ± SEM shown whiskers, n = 10 patients for each group, (P>0.05, One way ANOVA).

