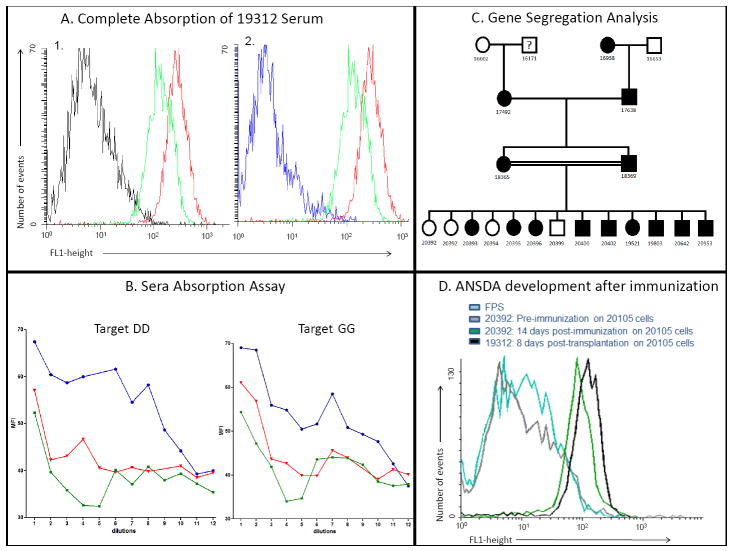
Figure 1.
A: Determining the number of antigens involved and gene segregation: In Figure 1A-1, PBMCs from a SLAdd PAA-2 positive animal were incubated for 30’ with serum from an antibody-producing SLAdd animal (19312, green curve), or fetal pig serum (FPS, black curve, negative control) or anti-SLAdd pig serum (red curve, positive control). After a wash, FITC labeled goat-anti swine IgG was added and incubated for 30’. After two more washes, the cells were analyzed by flow cytometry. Serum from 19312 showed presence of antibodies directed to an antigen present on the surface of the MHC-matched (SLAdd) target cells. Fig 1A-2: The same curves as shown in A-1, except that serum from 19312 was absorbed on PAA-2 positive cells prior to incubation with the target SLAdd PAA-2 positive cells (blue curve) and the negative control curve of fetal pig serum is not shown (for clarity, since it was essentially identical to that of the absorbed serum). Figure 1B: Representative data of the serum absorption assays. Serum from 20392, a PAA-2 negative animal that developed anti-PAA-2 antibodies after immunization, was absorbed at serial dilutions on cells from several PAA-2 positive animals bearing different MHCs (SLAdd, red curves, and SLAgg, green curves). The absorbed serum was then tested back on target cells from animals from the SLAdd (left panel) and SLAgg (right panel) lines. Essentially identical serum absorption curves were observed for absorption with either SLAdd and SLAgg cells, indicating that PAA-2 is a single antigen, or a set of antigens that segregate together. The blue lines are positive controls of serial dilutions of unabsorbed sera tested on the same target cells. Figure 1C: Pedigree of a family of animals analyzed in this study. By convention, circles indicate female animals and squares male animals. The segregation of PAA-2 positive (filled) vs. negative (open) animals is most consistent with Mendelian inheritance of the gene for PAA-2 in an autosomal dominant manner. Cells from animal 16171 were unfortunately not available for testing. Figure 1D: Antibody production in a naïve PAA-2 negative animal after immunization with a PAA-2 positive skin graft and subcutaneous PBMCs injections: Prior to immunization (grey curve) 20392 had no detectable anti-PAA-2 antibodies to 20105 (an animal known to be PAA-2 positive). Animal 20392 developed antibodies to PAA-2 after immunization with a skin graft and subcutaneous PBMCs injection (green curve). Animal 19312 had known anti-PAA-2 antibodies and was used as a positive control (black curve). The turquoise curve is a negative control in which the target cells were incubated with FPS before staining with the secondary goat-anti swine antibody.

