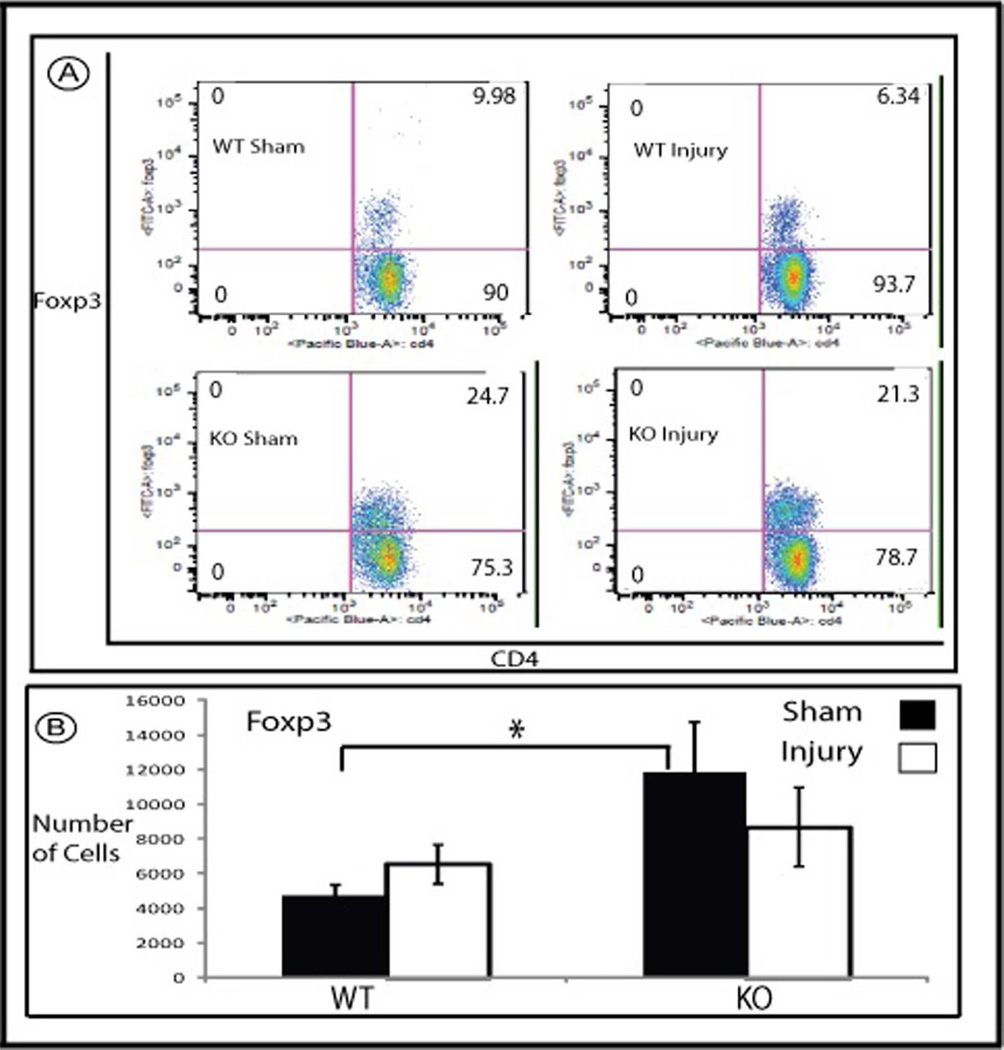
Figure 5.
Flowcytometry of mononuclear cells isolated from WT and HSF-KO mice. Panel A is representative flowcytometry of mononuclear cells marked with antibodies against Foxp3 and CD4, isolated from WT and HSF-KO mice kidney following sham surgery and ischemia followed by 1 hour reperfusion. Panel B is the summation of the flowcytometry data (mean +/− SEM) for Foxp3 positive cells, expressed as total number of cells (n=6–12 for all conditions). * represents p<0.02 between sham operated WT and HSF-KO.

