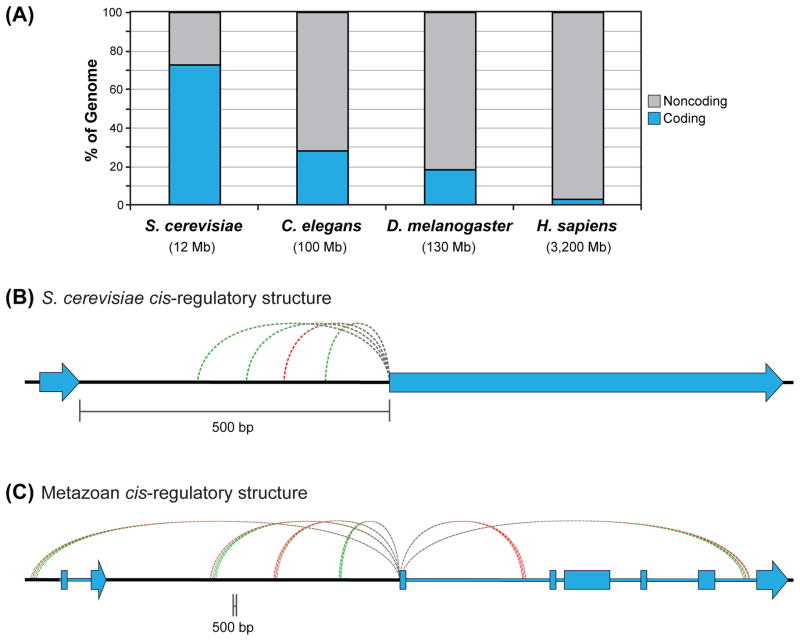
Figure 5. Distinct cis-regulatory structure of unicellular and metazoan model organisms.
(A) Percentages of coding and noncoding DNA in select genomes, adapted from [116].
(B) Typical regulatory structure of a Saccharomyces cerevisiae gene, with most regulatory DNA binding sites falling within a few hundred bases of the gene’s TSS.
(C) Typical regulatory structure of a human gene, with several clusters of regulatory DNA sites (enhancers) distal to the TSS.
For (B) and (C), green dashed lines represent activating regulatory inputs, and red dashed lines represent repressive inputs.

