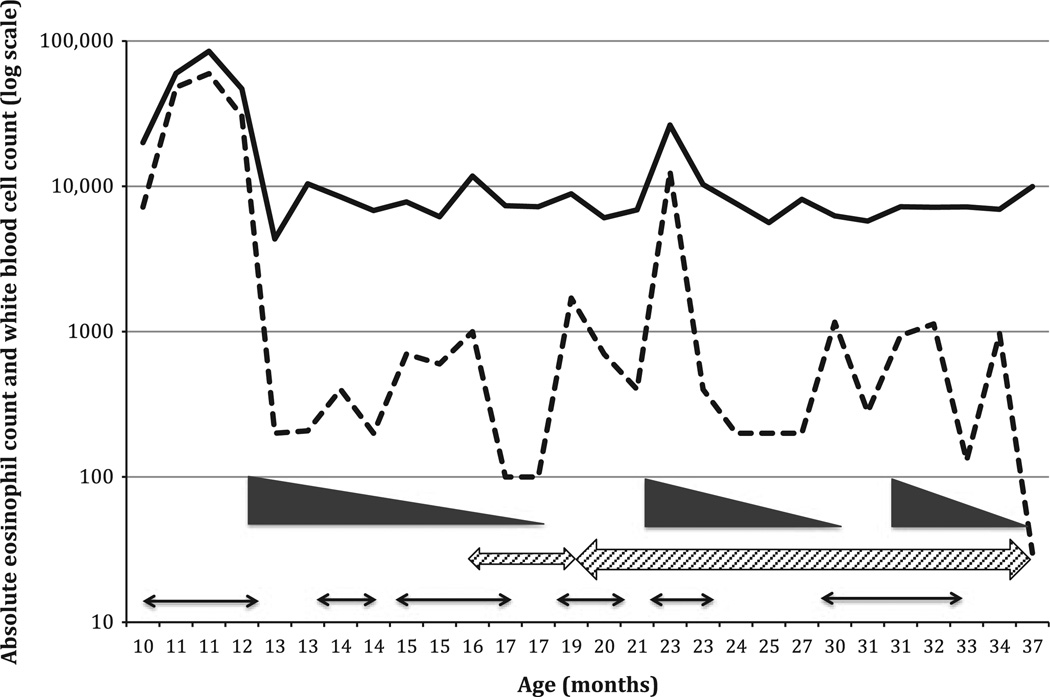
Figure 2.
Therapy induced changes in total white cell and eosinophil counts. Total cell counts shown on the y-axis as log10 scale of cells/µl and the x-axis shows patient’s age in months. Total white cell count is shown as the solid line and total eosinophil count as the dotted line. Timing of prednisone therapy (1 mg/kg and weaned) is shown as the solid wedges; rash is shown as the thin arrows, and hydroxyurea as the hashed arrows. At 19 months of age, hydroxyurea was increased from 12 mg/kg/day to 16 mg/kg/day (wider hashed arrow).

