
Figure 7. Loss of OPC HIF1/2 α function is permissive for cortical development and angiogenesis.
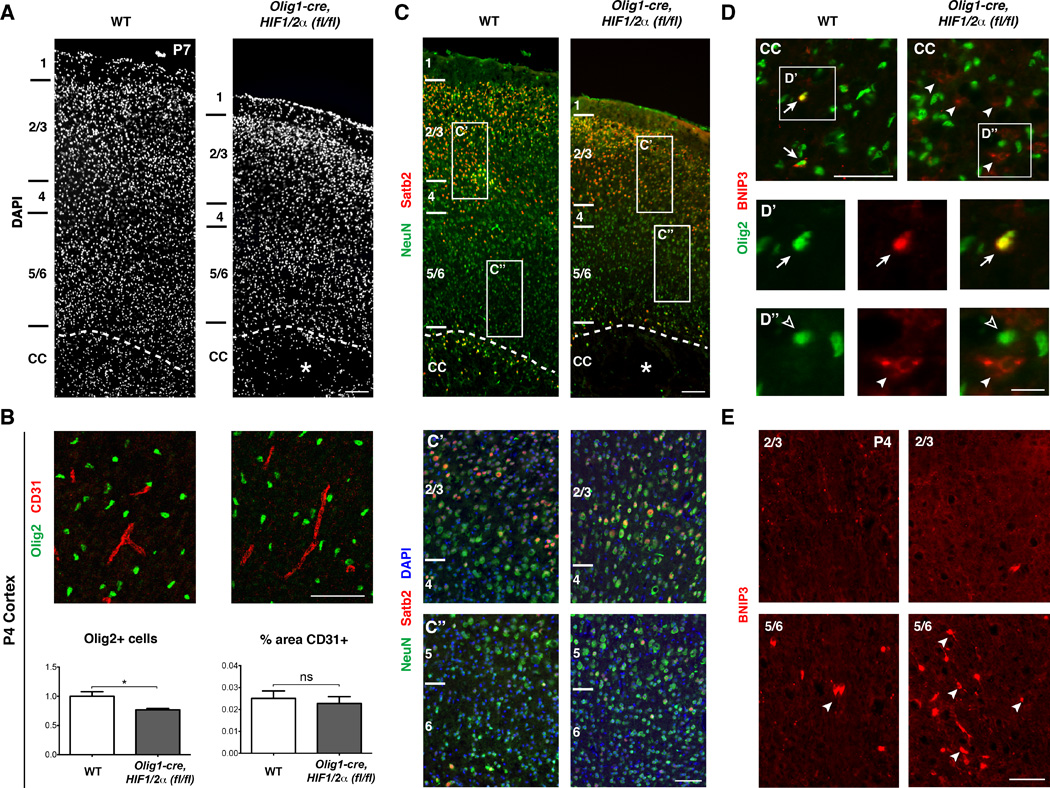
(A) DAPI stain of primary motor cortex in WT versus Olig1-cre, HIF1/2α(fl/fl) mice at P7 showing a thinner cortex in Olig1-cre, HIF1/2α(fl/fl) with the cortical layers and overall structure intact. Cortical layers are labeled to the left, and the asterisk denotes white matter cyst. n=3 animals/genotype. Scale bar: 200µm.
(B) OL numbers are reduced by approximately 23% in Olig1-cre, HIF1/2α(fl/fl) cortex, but vessel density (%CD31) is not statistically different. Data were analyzed by a two-tailed Student’s t-test and the significant difference (*p<0.05) is shown. n=3 animals/genotype. Scale bar: 100µm.
(C) Images of NeuN (green, pan-neuron marker), SatB2 (red, layer 2/3 callosal projection neurons), and DAPI providing further evidence that the cortex is grossly intact with ample numbers of callosal projection neurons. Note in higher magnification panels (C’ and C”) that cell density is grossly normal in Olig1-cre, HIF1/2α(fl/fl) cortex. Scale bars: 200µm; 100µm (insets).
(D) Images of the corpus callosum stained for BNIP3 (red) and Olig2 (green). In WT, BNIP3 is expressed in a subset of Olig2+ cells (arrows, D’ insets). In Olig1-cre, HIF1/2α(fl/fl) mice, while BNIP3 is not expressed in Olig2+ cells, aberrant expression of BNIP3 in non-Olig2+ cells (arrowheads, D” insets) is indicative of the general hypoxic microenvironment. Scale bars: 100µm; 20µm (insets).
(E) Images of BNIP3 staining in dorsal cortex (top row) and ventral cortex (bottom row). BNIP3 is enriched in ventral, but not dorsal cortex, suggesting selective hypoxia in grey matter regions adjacent to the corpus callosum, but not more dorsal areas. n=3 animals/genotype. Scale bar: 100µm.