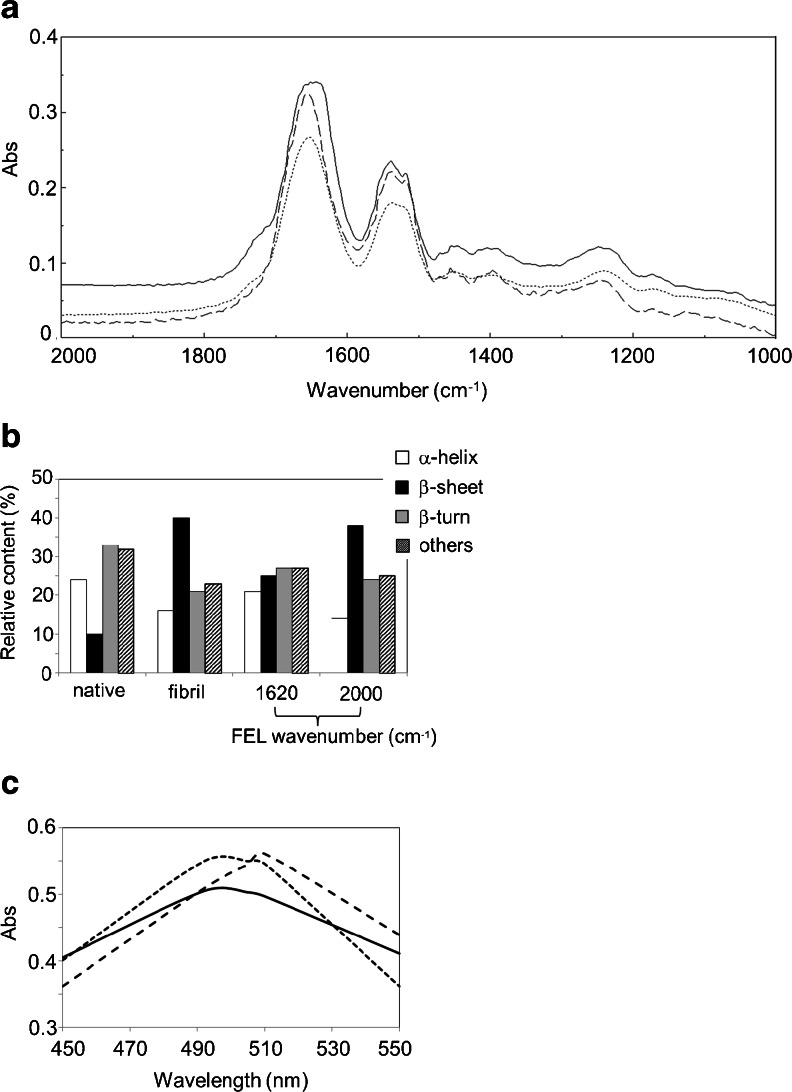
Fig. 2.
Structural changes in insulin. a FT-IR spectra before and after FEL irradiation at 1,620 cm−1 for 1 h. The solid line represents the spectrum of the insulin fibrils before irradiation, the dotted line represents that after irradiation, and the dashed line represents the spectrum of native insulin. b Secondary structure analyses. Relative contents were calculated based on the protein analysis software (IR-SSE). Others indicates the disordered region. c CR assay. The solid line represents the spectrum of CR (0.2 mM) with native insulin (ca. 2.0 mg/mL), the dashed line represents that with insulin fibrils, and the dotted line represents that with the fibrils following FEL irradiation

