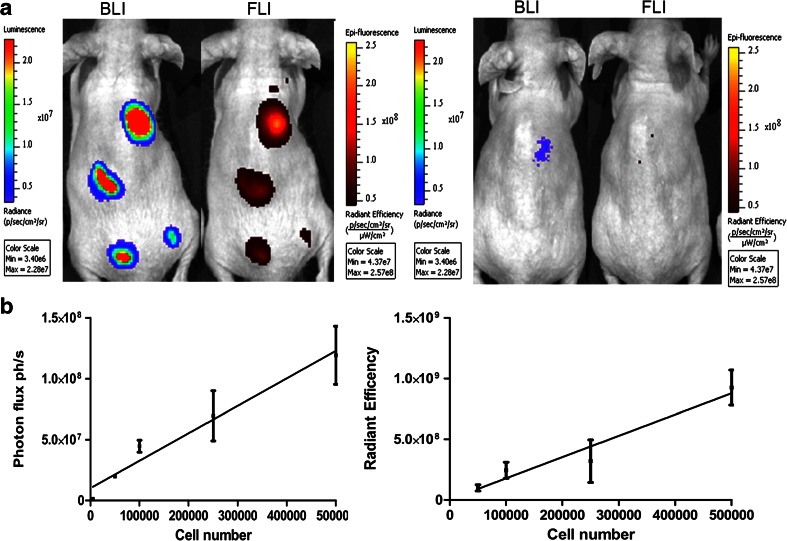
Fig. 3.
a Representative bioluminescence and fluorescence images of a mouse subcutaneously injected with 5 × 10⁴, 1 × 10⁵, 2.5 × 10⁵, and 5 × 10⁵ HEK-293 cells expressing TurboLuc (on the left) and 5 × 10², 5 × 10³ cells (on the right). Bioluminescence measurement allowed detecting 5 × 10³ cells while fluorescence imaging, 5 × 10⁴ cells. b Graph showing the linear correlation between luminescent signals and the number of injected cells

