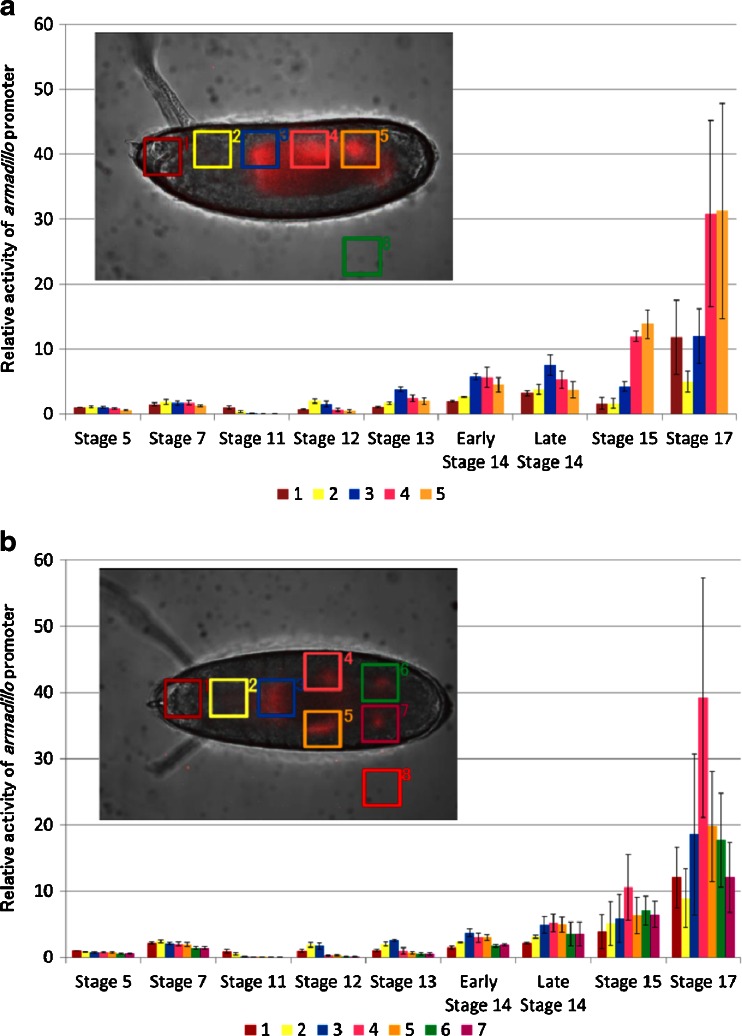
Fig. 2.
Time course analysis of arm expression at six regions of interest (ROI) at several stages with lateral (a) and dorsal (b) views, with the anterior end to the left. arm expression is shown as the luminescent signal ratio of each ROIs per ROI 1 in stage 5 of (a) or (b) after subtraction of the background obtained from ROI-6 (a) or ROI-8 (b). Data are presented as mean ± SE (n = 3). ROIs were assigned at presumptive areas of the cephalic region (1), the proventriculus (2), the anterior midgut rudiment region (3), myoblasts of the dorsal/lateral musculature region (a (4), b (4 and 5)), the posterior spiracle region (a (5), b), and the background area (a (6), b (8))

