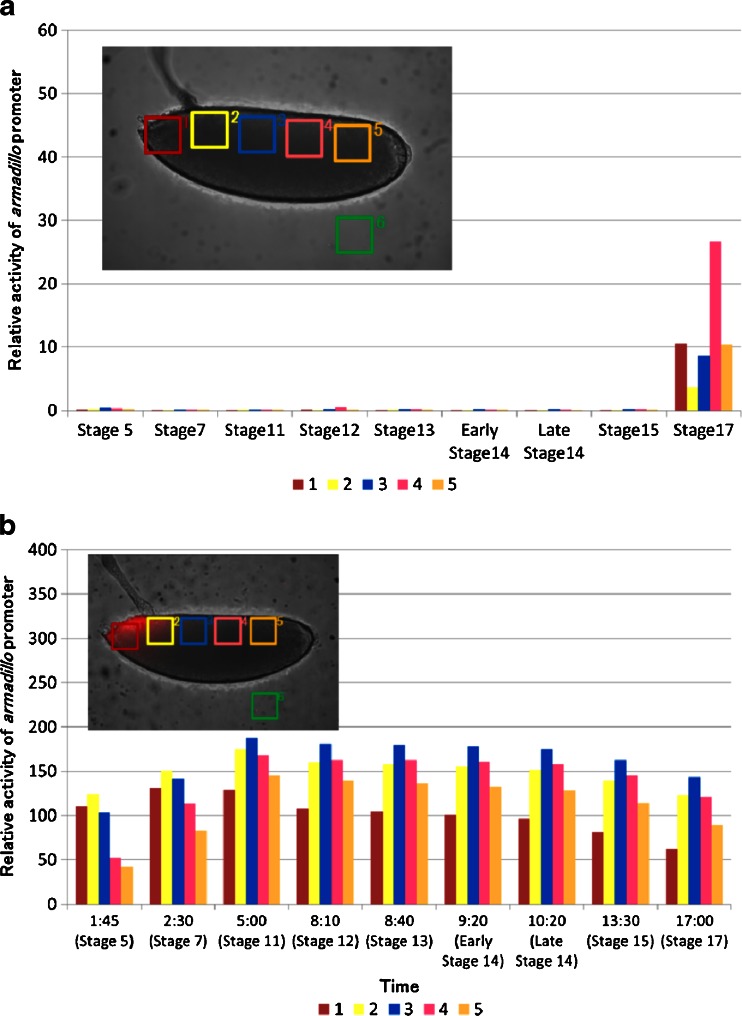
Fig. 7.
Time course analysis of arm promoter activity in six regions of interest (ROI) after treatment with ionomycin (a) and BIO (b). arm expression is presented as the luminescent signal intensity of ROIs relative to ROI-1 in stage 5 of untreated embryos after subtracting the background obtained from ROI-6. ROIs were defined at presumptive areas of the cephalic region (1), the proventriculus (2), the anterior midgut rudiment region (3), myoblasts of the dorsal/lateral musculature region (4), the posterior spiracle region (5), and the background area (6). Because there was no obvious progression in the developmental stages of BIO-treated embryo (b), relative intensity of luminescent signal was calculated at the indicated time after egg laying. The embryonic stages in normal development corresponding to each time were shown in parentheses

