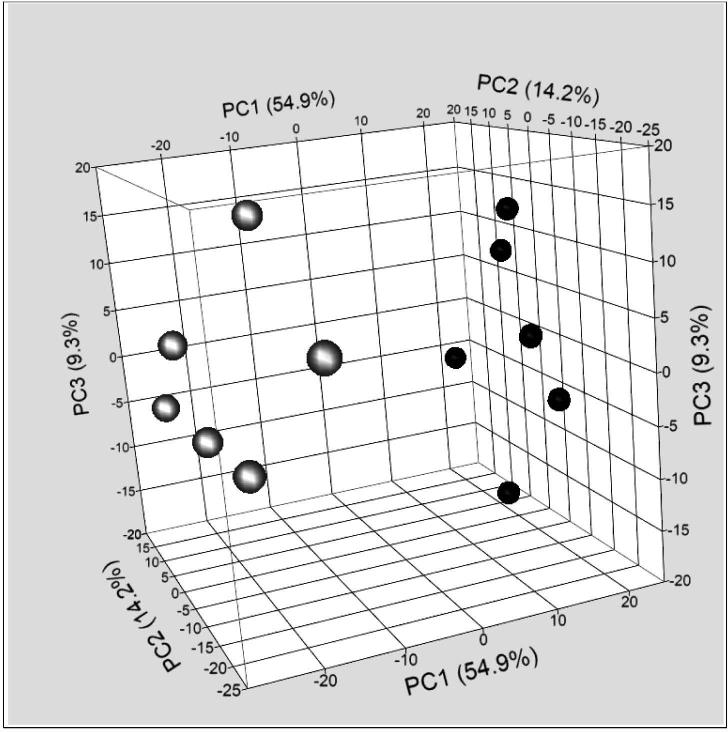
Figure 4. Principal component analysis of gene expression in mogp-TAg and WT mice.
FT from mogp-TAg mice (represented by white/grey filled circles) showed a distinct pattern of gene expression compared to FT form WT mice (black filled circles) as depicted both by the PCI values and the visual appearance of the 3D scatterplot.

