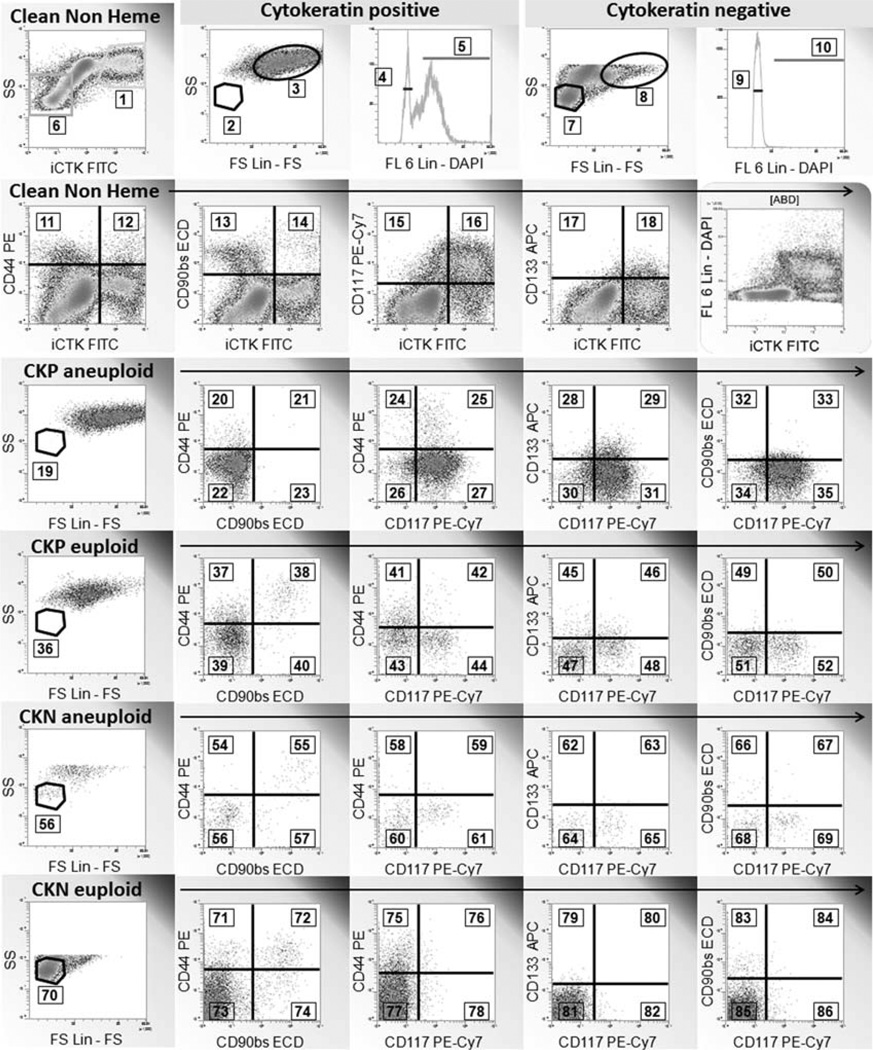
Figure 1.
Regions and gates used in mutivariate analysis. This example shows a lung adenocarcinoma. Logical gates applied to each histogram are shown above the histogram frame. The “Clean Non Heme” gate was created on CD45-/CD14-/CD33-/glycophorin A-singlet events with DNA content ≥ 2N (not shown). The region numbers indicate the markers used for multivariate analysis and are keyed to Table 1. CKP + cytokeratin+, CKN = cytokeratin negative Euploid = gated on region 4 or 9. Aneuploid = gated on region 5 or 10. The euploid and low light scatter regions were matched to tissue infiltrating lymphocytes (not shown).

