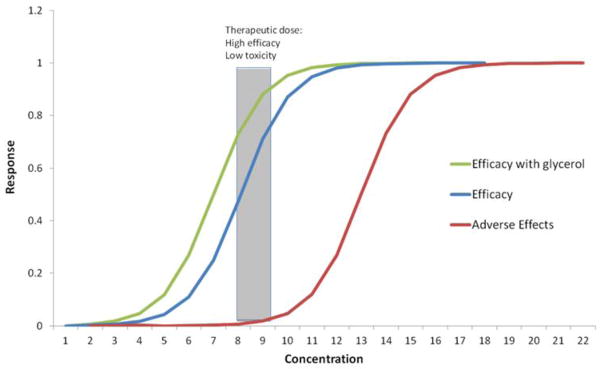
Figure 12.

Illustration of theoretical response curves for adverse effects (toxicity) and efficacy. X-axis is the concentration of a test compound and Y-axis is the response level. Low concentrations elicit low responses (toxicity or efficacy) and high concentrations elicit greater responses until saturation. Optimal therapeutic dose is the concentration range where there is high efficacy and low toxicity.
