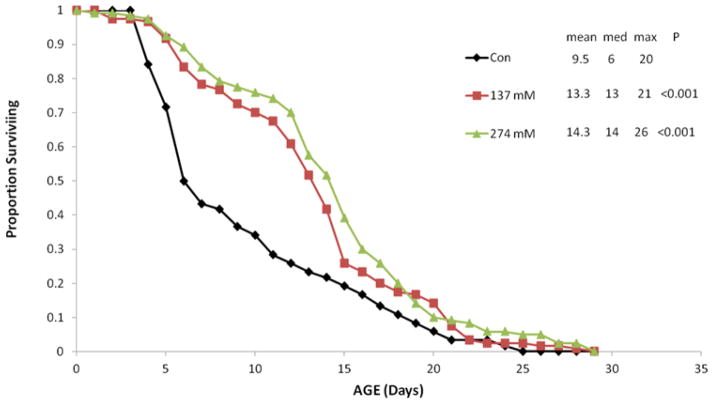
Figure 2.
Survival curves for B. manjavacas continuously exposed to 0, 137 or 274 mM glycerol. Proportion surviving represents the fraction of an initial cohort of 120 rotifers surviving to the indicated age. Mean, median and maximum lifespan (5% surviving) are reported in days. P refers to the Wilcoxson test probability that the treatment survival curves are similar to control.

