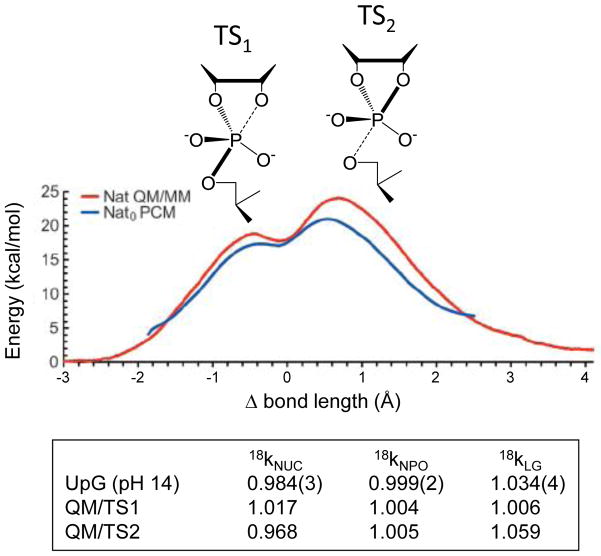
Figure 2.
Density-functional QM/MM free energy and adiabatic PCM profiles for the reaction of an RNA transphosphorylation model. Free energy is plotted as a function of the difference (Δ) in bond length between the 5′O-P and O2′-P bonds. The calculated density-functional free energy barrier is similar to experiment. The primary KIE values calculated for TS1 and TS2 by using an ab initio path-integral method are shown in the boxed table, below, compared to experimentally observed values.

